Fig. 5.

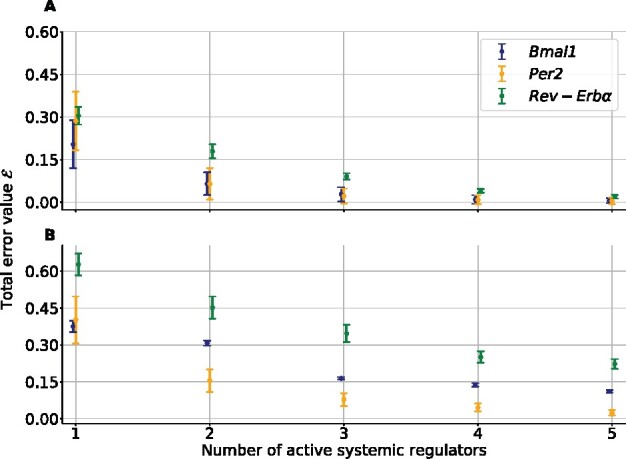
For each gene, the total error of the best-fitting model depending on its number of non-zero terms is reported for Transcription (A) and Degradation (B). Standard deviations are taken across residual trajectories

For each gene, the total error of the best-fitting model depending on its number of non-zero terms is reported for Transcription (A) and Degradation (B). Standard deviations are taken across residual trajectories