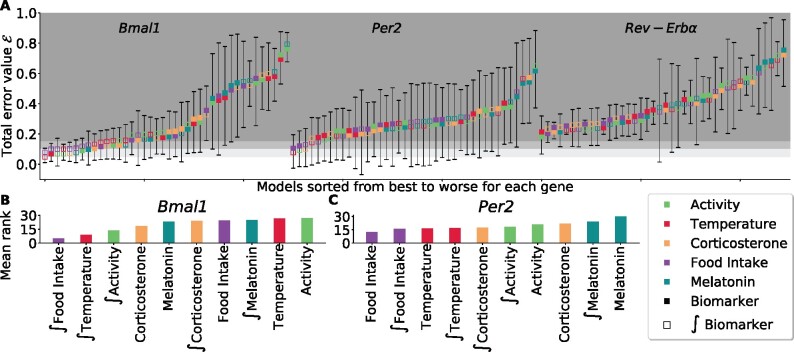
Fig. 6.
(A) Total error for each of the 40 2-term models representing a systemic control on either Bmal1, Per2 or Rev-erbα transcription. Means and standard deviations were computed across residual trajectories under H1–H3. Colors indicate regulators involved in each model, with the top square referring to the dominant regulator. Areas defined by different shades of gray refer to thresholds of total error equal to 0.05, 0.1 and 0.15. (B–C) Mean rank of regulators among the 40 2-term models, from lowest to highest, for models impacting Bmal1 or Per2 transcription

