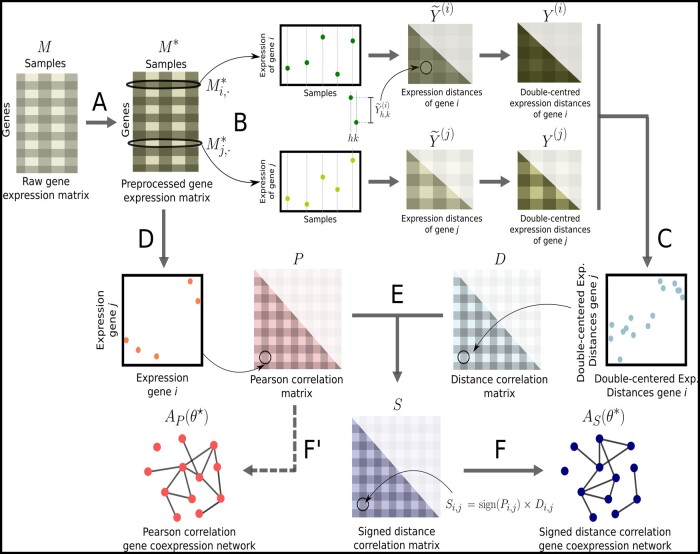
Fig. 1.
Pipeline to construct networks from gene expression data using signed distance correlation. (A) We pre-process the input matrix M with raw gene expression data using quantile normalization and setting the lowest 20% values from each sample to the minimum value in M to obtain . (B) We compute the expression distance matrices and for each gene , and we double center them to obtain and . (C) We compute the distance correlation matrix D, whose entries are the positive root of the Pearson correlation between and , for every pair of genes. (D) We compute the Pearson correlation between each pair of rows in the to obtain the Pearson correlation matrix P. (E) To construct the signed distance correlation matrix S, we multiply every distance correlation between the expression of two genes by the sign of their Pearson correlation . (F) Using COGENT (Bozhilova et al., 2020), we find the optimal threshold that produces the most self-consistent network from S. (F′) Analogously, we find the optimal threshold to generate the network from P; this step is not part of the pipeline and only necessary to be able to compare Pearson and signed distance correlation networks.

