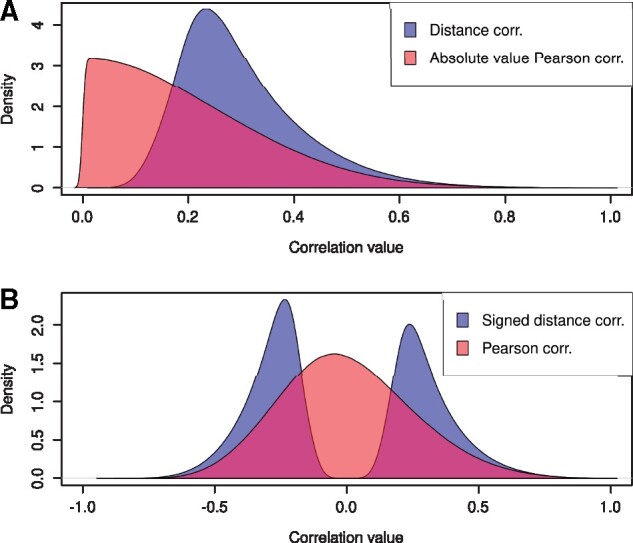
Fig. 2.

Distribution of the entries of the correlation matrices from the R.leguminosarum dataset. (A) Distribution of distance correlations in D (blue), and the absolute of the Pearson correlations (red). (B) Distribution of signed distance correlation S (blue), and Pearson correlation P (red).
