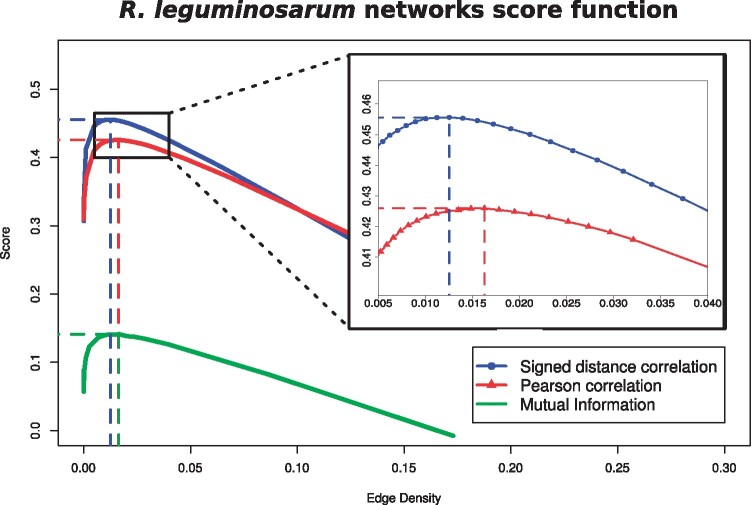
Fig. 3.
Self-consistency scores of R.leguminosarum networks with edge densities between 0 and 0.3. The blue line with circles shows the scores of networks obtained using signed distance correlations; the red line with triangles shows the score of networks using Pearson correlations; the green line shows the scores of the networks obtained using MI. The dashed vertical lines indicate the density of the most self-consistent network for each type of correlation.

