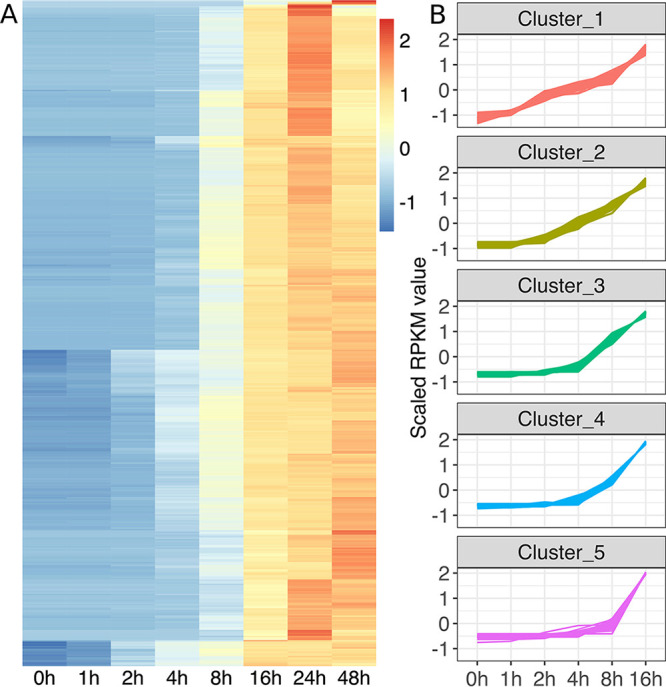
FIG 2.

Expression of medusavirus genes at different time points during the course of medusavirus infection. (A) Heatmap of medusavirus gene expression profiles. Each column represents one time point; each row represents a viral gene; the color scale indicates Z-score scaled RPKM values. (B) Medusavirus temporal gene expression profiles in the five clusters. x axis, time points postinfection; y axis, Z-score scaled RPKM value for each gene. Each line represents a viral gene.
