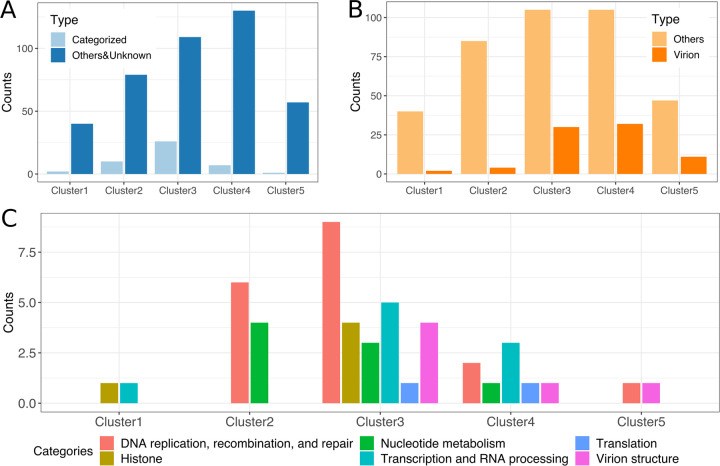
FIG 3.
Distribution of genes with annotated functions among the five expression clusters. (A) Numbers of unknown and annotated genes in the expression clusters. Light blue indicates genes with categorized functions; dark blue indicates genes with uncategorized or unknown function. (B) Numbers of genes in the expression clusters. Light orange indicates genes that encode proteins not packaged in virions; dark orange indicates genes that encode proteins packaged in virions (2). (C) Numbers of functionally annotated genes in each of the expression clusters.

