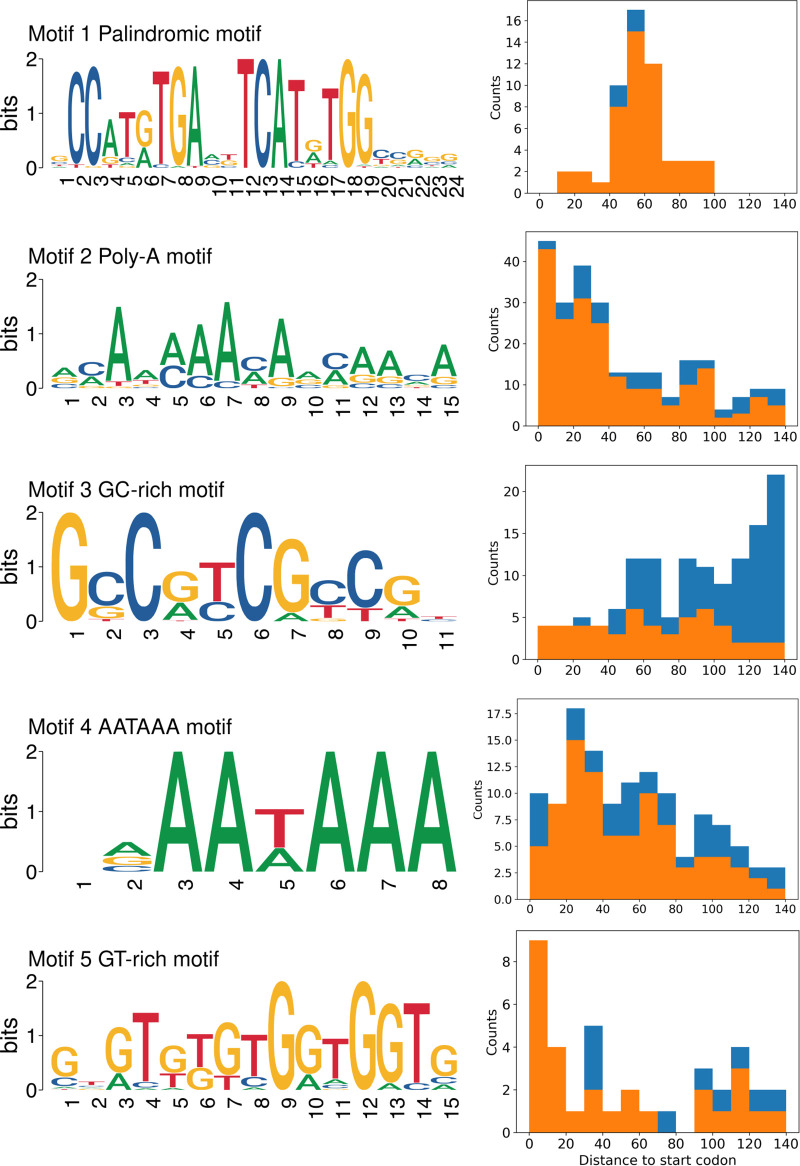
FIG 6.
Sequence motifs enriched in the 5′ region upstream of the genes in the medusavirus genome and their distribution relative to the corresponding start codon. (Left panel) Motif name and its logo; (right panel) distance to the corresponding start codon; orange indicates motifs that did not overlap neighboring genes; blue indicates motifs that overlapped with neighboring genes.

