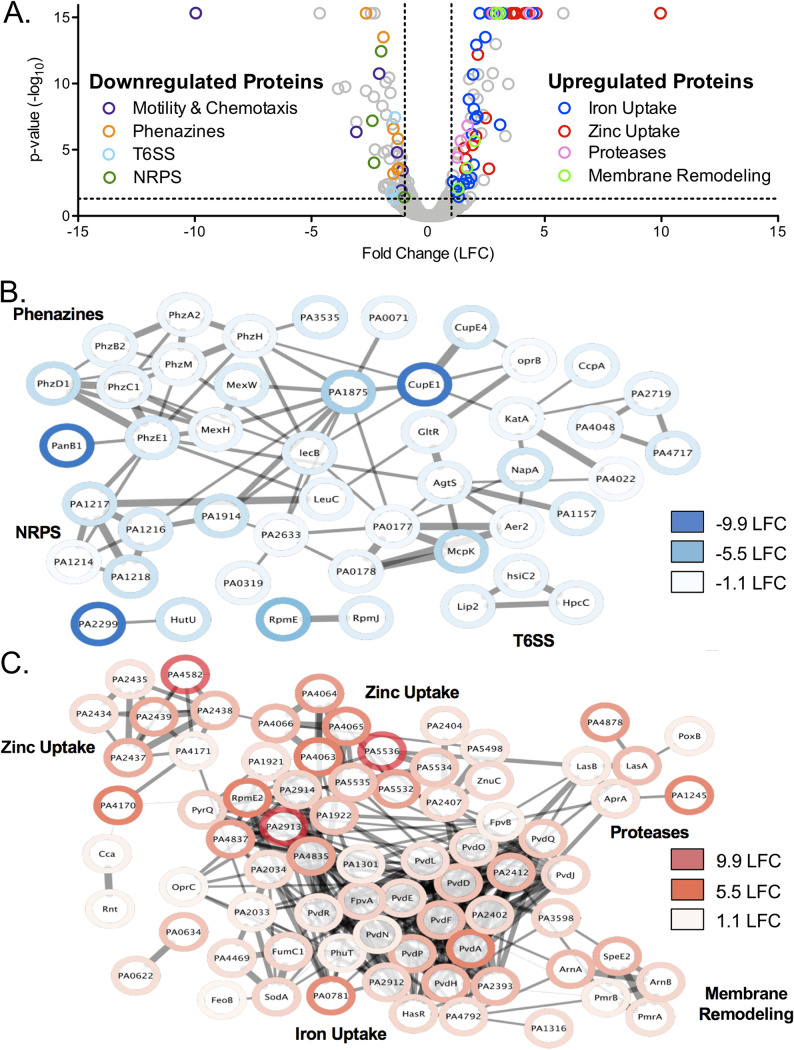
FIG 1.
Proteomic analysis of P. aeruginosa response to CP. (A) Volcano plot of PA14 response to CP treatment. Every protein detected in the experiment is represented by an open, gray circle. Circles representing significantly regulated proteins in functional categories of interest are highlighted with the colors indicated in the legend. The thresholds for significance (P < 0.05) and expression (1 log2 fold change [LFC], equivalent to a 2-fold change) are marked by a black dashed line. Proteomics was performed with an n of 5, and significance was determined by an ANOVA test corrected for multiple testing by applying a Benjamini-Hochberg procedure (84). (B, C) Network analysis was performed using the STRING database (49) on the proteins that were significantly downregulated (B) and upregulated (C) in response to CP treatment. The thickness of lines between proteins indicates the strength of the data supporting the interaction, with more data correlating to a thicker line. The network was transferred into Cytoscape (79), and proteomics expression data were integrated using the Omics Visualizer app (80).

