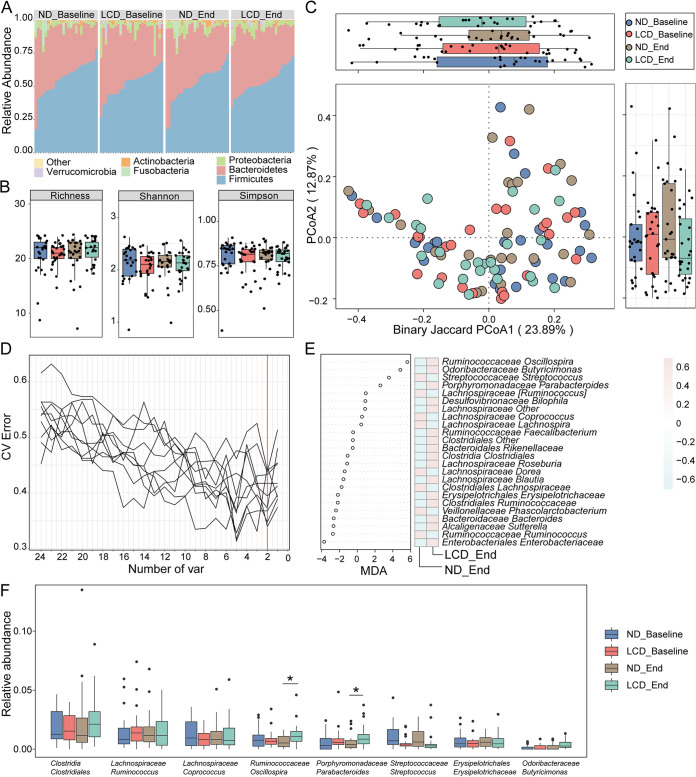
FIG 2.
Differential gut microbial characteristics in the ND and LCD groups at two different time points and potential bacterial markers of LCD intervention. (A) The overall composition and relative abundance of the bacterial community in each group at the phylum level were not significantly different. (B) Box plots of the α-diversity index (richness, Shannon, and Simpson) showed no significant difference in α-diversity indices between the ND group and LCD group at baseline stage or end stage. The horizontal lines in the box plots mean median values. The highest and the lowest boundaries of the box denote the 75% and 25% quartiles, and whiskers represent the lowest and highest values within 1.5 times the interquartile range (IQR) from the 25% and 75% quartiles, respectively. Dots represent data points beyond the whiskers. (C) The PCoA of β-diversity based on genus distribution by binary Jaccard algorithm showed that the gut taxonomic composition was not significantly different between the ND and LCD groups at the two different time points. (D) Two bacterial markers at the genus level were selected as optimal biomarkers of the random forest model in the ND and LCD groups after 12 weeks of dietary intervention. The red line illustrates the number of key bacteria in the discovery set. CV error, cross-validation error; var, variants. (E) The relative abundance of each bacteria at the genus level in the predictive model was assessed using mean decrease accuracy (MDA). The heat map illustrates the comparison of bacteria filtered by random forest via 5-fold cross-validation in the two groups at the end stage. (F) Box plots of all union optimal bacterial biomarkers selected through the random forest algorithm at baseline and end stages indicated that Porphyromonadaceae Parabacteroides and Ruminococcaceae Oscillospira were significantly increased in the LCD group after 12 weeks of LCD intervention. A two-way ANOVA with repeated measures followed by a Tukey post hoc test was used to compare multiple groups at different time points using GraphPad Prism 8.0.2; *, P < 0.05.

