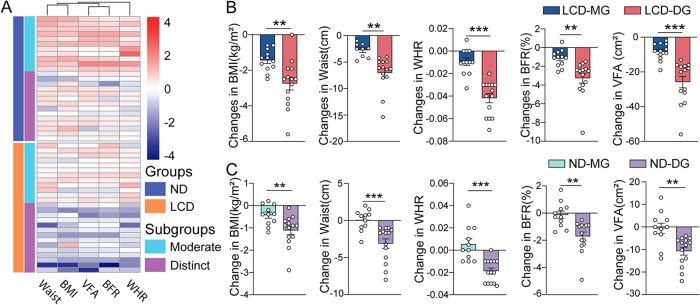
FIG 3.
Individual weight loss is varied under different dietary interventions. (A) Heat map clustered by changes in anthropometric parameters (waist, BMI, VFA, BFR, and WHR). Two groups were further classified into moderate weight loss groups (MG) and distinct weight loss groups (DG), respectively. (B) The obvious decrease in anthropometric parameters (BMI, waist, WHR, BFR, and VFA) of significant difference in LCD_DG compared to LCD_MG after 12 weeks of dietary intervention. Data are expressed as mean ± SEM and were analyzed by unpaired, two-sided Student’s t test; **, P < 0.01; ***, P < 0.001. (C) The slight reduction in anthropometric parameters (BMI, waist, WHR, BFR, and VFA) in ND_DG compared to that in ND_MG. Data are expressed as mean ± SEM and were analyzed by unpaired, two-sided Student’s t test; **, P < 0.01; ***, P < 0.001.

