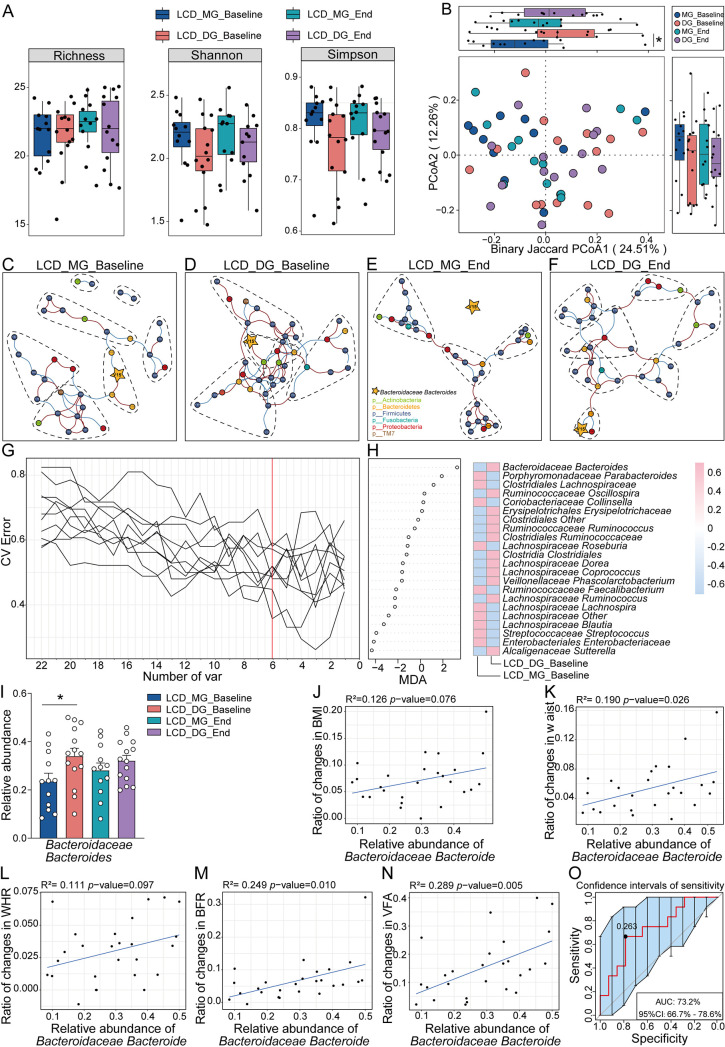
FIG 4.
Microbial composition is a determining factor regarding distinct weight loss efficacy under LCD intervention. (A) Box plots of the α-diversity index (richness, Shannon, and Simpson) at the genus level showed no significant difference between LCD subgroups at baseline stage or end stage. (B) The PCoA of β-diversity based on genus distribution by binary Jaccard algorithm showed that the gut taxonomic composition was significantly different between LCD subgroups at baseline but not end stage; *, P = 0.0481 is from least significant difference (LSD). (C to F) The cooccurrence networks before and after LCD intervention reflect network interaction complexity. All nodes were colored at the phylum level (isolated nodes were excluded), and edges were estimated by Spearman’s rank correlation coefficient (abs[r] > 0.3, P < 0.05). On the whole, LCD_DG exhibited stronger and broader network interaction complexity than LCD_MG at two different time points. (G) Six markers at the genus level were selected as optimal biomarkers of the random forest model in LCD subgroups at baseline. The red line illustrates the number of key bacteria in the discovery set. (H) The relative abundance of each bacteria at the genus level in the predictive model was assessed by MDA. The heat map illustrates the comparison of bacteria filtered by random forest via 5-fold cross-validation in the two subgroups at the baseline stage. (I) The relative abundance of Bacteroidaceae Bacteroides, selected through the random forest, was significantly higher in LCD_DG than in LCD_MD at the baseline stage. Data are expressed as mean ± SEM, and a two-way ANOVA with repeated measures followed by a Tukey post hoc test was used to compare multiple groups at different time points using GraphPad Prism 8.0.2; *, P < 0.05. (J to N) Linear regression indicates that the relative abundance of Bacteroidaceae Bacteroides was positively correlated with the ratio of changes in weight loss parameters (BMI, waist, WHR, BFR, and VFA). (O) The baseline relative abundance of Bacteroidaceae Bacteroides achieved an AUC value of 73.2% with a 95% confidence interval (95% CI) of 66.7% to 78.6% between LCD_MG and LCD_DG to predict the outcome of weight loss efficacy.

