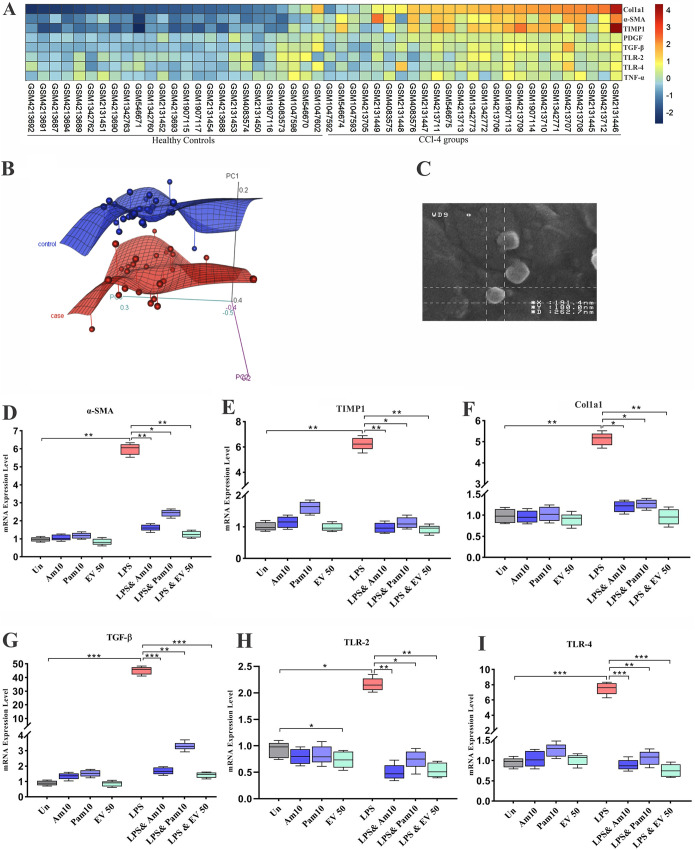
FIG 1.
(A) A heatmap plot of microarray data sets meta-analysis. A P value of <0.05 was considered statistically significant by Mann-Whitney method. (B) PCA plot shows separated cluster between two groups. (C) Scanning electron microscopy shows spherical morphology of EVs (magnification: ×60,000). Inhibition of HSC activation and protective effects of all A. muciniphila supplementations in LX-2 cell line. mRNA level of HSCs activation-related genes, (D) α-SMA, (E) TIMP1, (F) Col1a1, (G) TGF-β, (H) TLR-2, and (I) TLR-4, in quiescence and LPS-activated LX-2 cells. Data are expressed as mean ± standard deviation (SD) (n = 5). *, P < 0.05; **, P < 0.01; and ***, P < 0.001 by post hoc Turkey’s one-way ANOVA.

