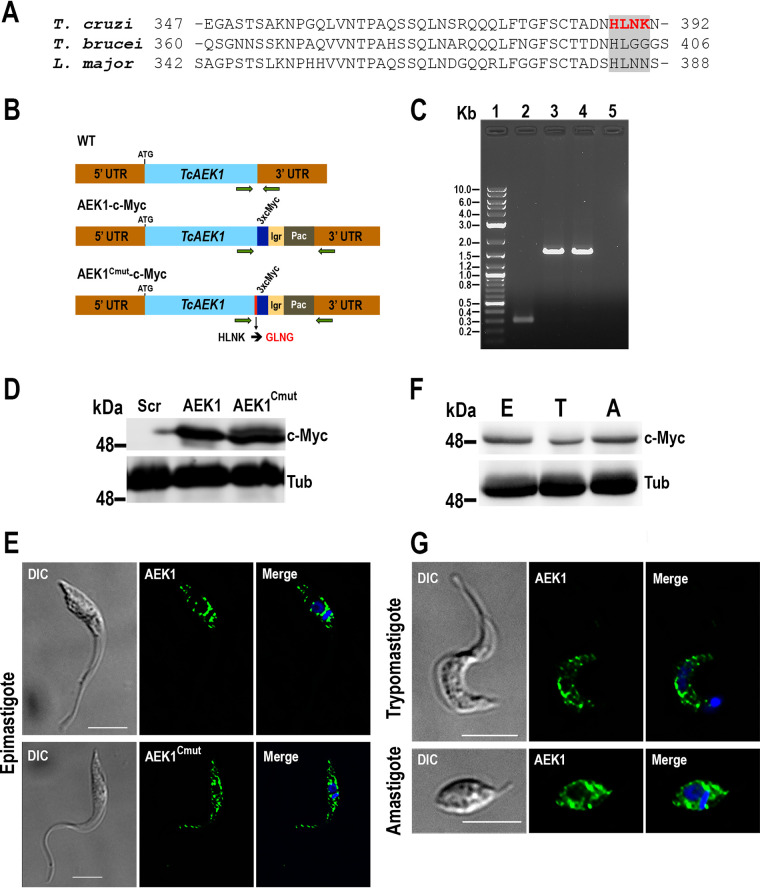
FIG 2.
Analysis of expression of endogenously tagged TcAEK1-3xc-Myc. (A) Amino acid sequence alignment of the C-terminal region of AEK1 orthologs from T. cruzi, T. brucei, and L. major (TriTrypDB IDs: TcYC6_0120630, Tbg972.3.2430, and LmjF.25.2340, respectively). Enclosed in a gray box, a putative ER retention signal is highlighted in red text (T. cruzi): KKXX-like motif in the C terminus (HLNK) predicted by WoLF PSORT method (https://wolfpsort.hgc.jp/). (B) Schematic representation of TcAEK1 (WT), endogenously tagged TcAEK1-3xc-Myc (AEK1-c-Myc), and TcAEK1Cmut-3xc-Myc, which has the KKXX-like motif mutated from HLNK to GLNG amino acid residues (AEK1Cmut-c-Myc). UTR, untranslated region; Igr, tubulin intergenic region; Pac, puromycin N-acetyltransferase. Horizontal green arrows indicate primers used for tagging verification. (C) PCR verification of integration of DNA donor in the 3′ end of the endogenous TcAEK1 locus. TcAEK1 allele size: WT, 300 bp; 3xc-Myc-tagged, 1,581 bp. Lanes: 1, 1-kb plus ladder; 2, scrambled control; 3, TcAEK1-3xc-Myc; 4, TcAEK1Cmut-3xc-Myc; 5, PCR negative control. (D) TcAEK1 endogenous tagging was verified by Western blotting using anti-c-Myc antibodies (c-Myc). Tubulin (Tub) was used as a loading control. Scr, scrambled; AEK1, TcAEK1-3xc-Myc; AEK1Cmut, TcAEK1Cmut-3xc-Myc. (E) Immunofluorescence analysis (IFA) showed localization of endogenously tagged TcAEK1-3xc-Myc (upper panel) and TcAEK1Cmut-3xc-Myc (lower panel) epimastigotes detected with anti-c-Myc antibodies (green). Merge of green signal (AEK1) and DAPI staining (blue) and DIC images are also shown. Scale bars represent 5 μm. (F) Representative Western blotting of TcAEK1-3xc-Myc in total extracts of epimastigotes (column E), tissue culture cell-derived trypomastigotes (column T), and amastigotes (column A) using anti-c-Myc antibodies. Tubulin was used as the loading control. (G) IFA shows localization of endogenously tagged TcAEK1-3xc-Myc detected with anti-c-Myc antibodies (green) in trypomastigote and amastigote. Merge of green signal (AEK1) and DAPI staining (blue) and DIC images are also shown. Scale bars represent 5 μm.

