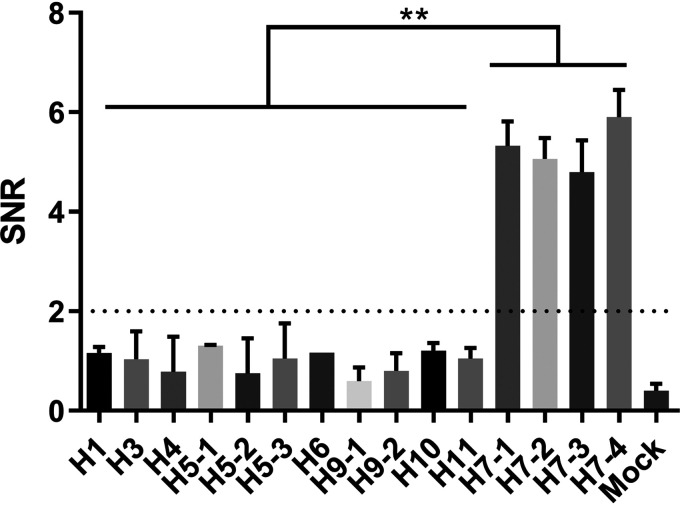
FIG 2.
The signal-to-noise ratios (SNRs) of the reactions between antisera against different subtypes of AIVs and H7-12 peptides. Sera were diluted 1:100 (vol/vol) with PBS and screened with the peptide microarray to assay binding activity. SNRs were determined by using GenePix Pro 6.0 software. The dotted line represents an SNR of 2. Each reaction was repeated 3 times, and SNRs are expressed as mean values ± standard deviations. **, P < 0.01.

