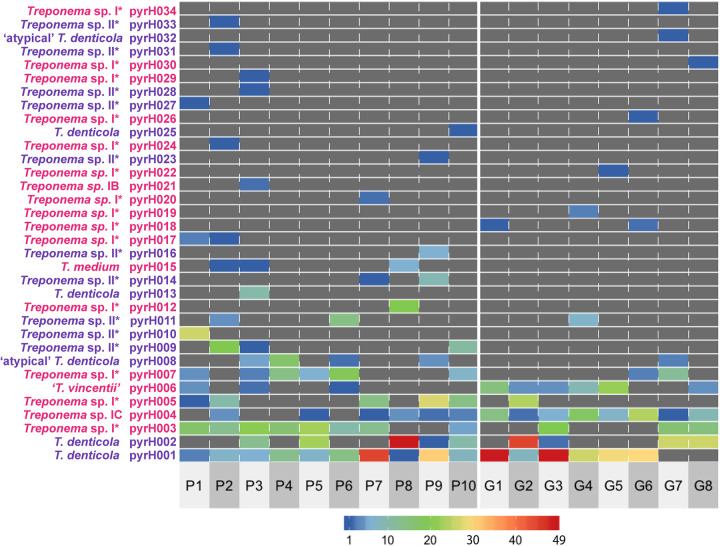
FIG 1.
Heat map showing the clonal abundances of the 34 oral treponeme pyrH genotypes detected within the oral cavity of each subject. The designations of the 34 treponeme pyrH genotypes (pyrH001 to pyrH034) are shown on the y axis. The pyrH genotypes that correspond to oral phylogroup 2 taxa are shown in purple, and those that correspond to phylogroup 1 are shown in pink. The identifiers of the 18 subjects are indicated below the x axis (P1 to P10, periodontitis group; G1 to G8, gingivitis group). The clonal abundance of each treponeme pyrH genotype (i.e., the number of cloned pyrH gene sequences assigned to each pyrH genotype) in each subject is represented by color according to the scale bar shown below the heat map, in values ranging from 1 (dark blue) to 49 (red). Zero values are colored dark gray.

