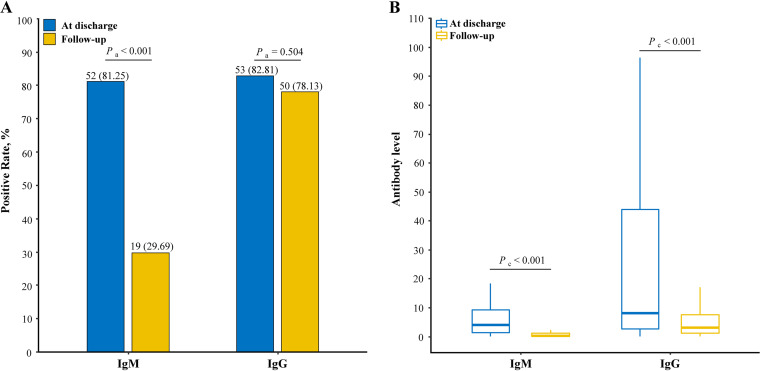
FIG 4.
Seropositivity and antibody levels of IgM and IgG against SARS-CoV-2 at discharge and follow-up. (A) Positive rates of IgM and IgG presented in bar plots; 100% denotes 64 participants were IgM/IgG seropositive. (B) Chemiluminescent immunoassay measurements of IgM and IgG presented in box plots. Pa represents that the P value was produced by chi-square test, and Pc represents that the P value was produced by Wilcoxon rank sum (Mann-Whitney) test.

