Fig. 1.
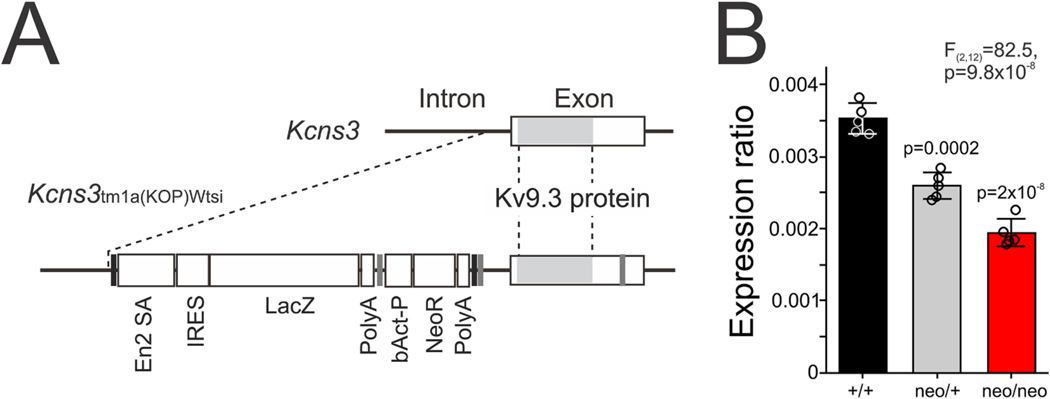
Gene trapping of Kcns3. A) The structure around the only protein-coding exon of wild type (top) and Kcns3tm1a(KOMP)Wtsi (bottom) alleles. The Kv9.3 protein-coding sequence in the exon is indicated by the shaded region. Broken lines connect the equivalent positions in both alleles. Vertical black lines: FRT sites, Vertical gray lines: loxP sites, En2SA: mouse En2 splicing acceptor site, IRES: Internal ribosomal entry site, LacZ; beta-galatosidase gene, Poly-A: SV40 polyadenylation sites, bAct-P: human β-actin promoter, NeoR: Neomycin resistance gene. B) Bar graphs summarizing the mean ± SEM expression levels of Kcns3 mRNA in the frontal cortex of Kcns3+/+, Kcns3neo/+ and Kcns3neo/neo mice (n = 5 per genotype) measured by real-time quantitative PCR (qPCR). Expression levels were ratios against the geometric mean of three internal control transcripts. The data of individual mice are presented by open circles superimposed over each bar. The F and p values reported are from One-way analysis of variance (ANOVA). P values of Tukey post-hoc comparisons versus Kcns3+/+ mice are shown above each bar for Kcns3neo/+ and Kcns3neo/neo mice.

