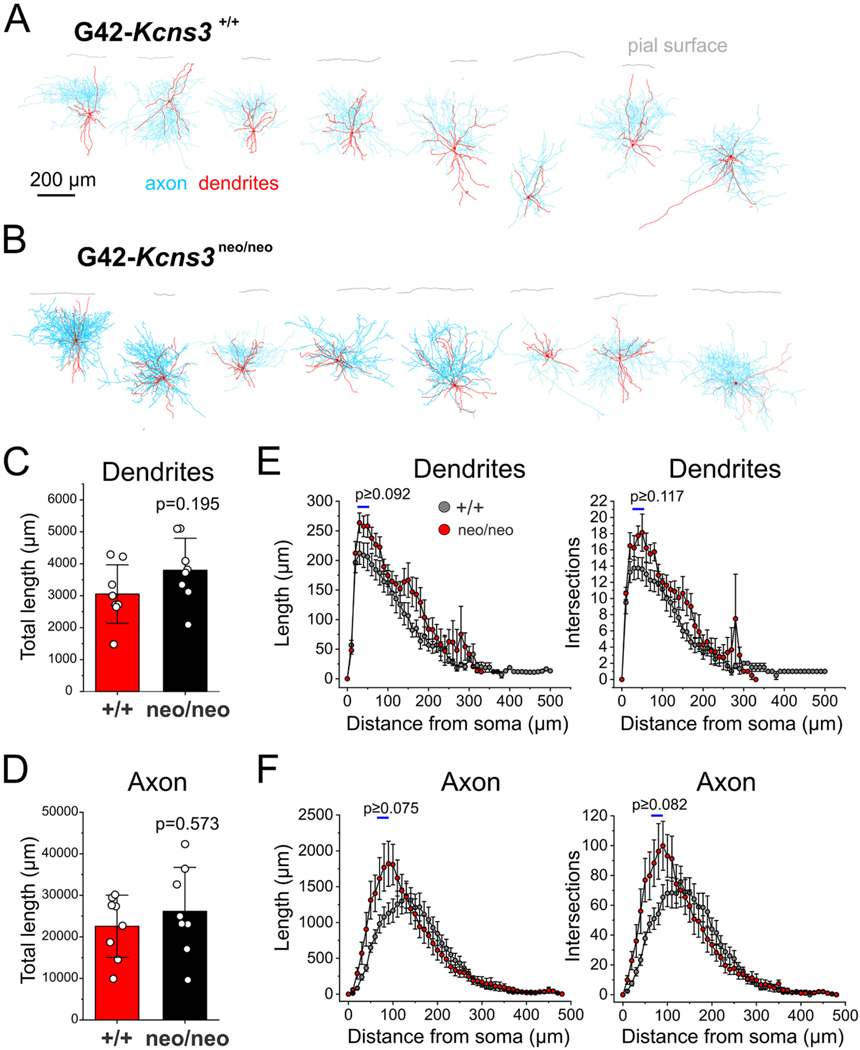
Fig. 4.
Morphology of the parvalbumin-positive (PV) neurons studied in prefrontal cortex slices from G42-Kcns3+/+ and G42-Kcns3neo/neo mice. A) Digital reconstructions (n = 8 cells from 5 mice) of PV basket cells (PVBCs) recorded in slices from G42-Kcns3+/+ mice. B) Digital reconstructions (n = 8 cells from 5 mice) of PVBCs recorded in slices from G42-Kcns3neo/neo mice. Calibration bar and labels apply to both A) and B). C) Bar graph displaying the total length of the dendritic tree of PVBCs from G42-Kcns3+/+ (n = 8 cells from 5 mice) and G42-Kcns3neo/neo mice (n = 8 cells from 5 mice). Shown here, and in D), are the p values from Mann- Whitney tests performed after Shapiro-Wilk tests of the residuals produced p < 0.05 for both the original data and the Ln-transformed data. D) Bar graph displaying the total length of the axonal arbor of PVBCs from G42-Kcns3+/+ and G42-Kcns3neo/neo mice, same cells as in C). E) Plots of dendrite length (left panel) and number of intersections (right panel) from Sholl analysis of the same neurons in C). Shown here, and in F), are the smallest p values from t-test comparisons done for the three Sholl compartments with largest differences between genotypes, indicated by horizontal bars. F) Plots of axon length (left panel) and number of intersections (right panel) from Sholl analysis of the same neurons in C).

