Fig. 7.
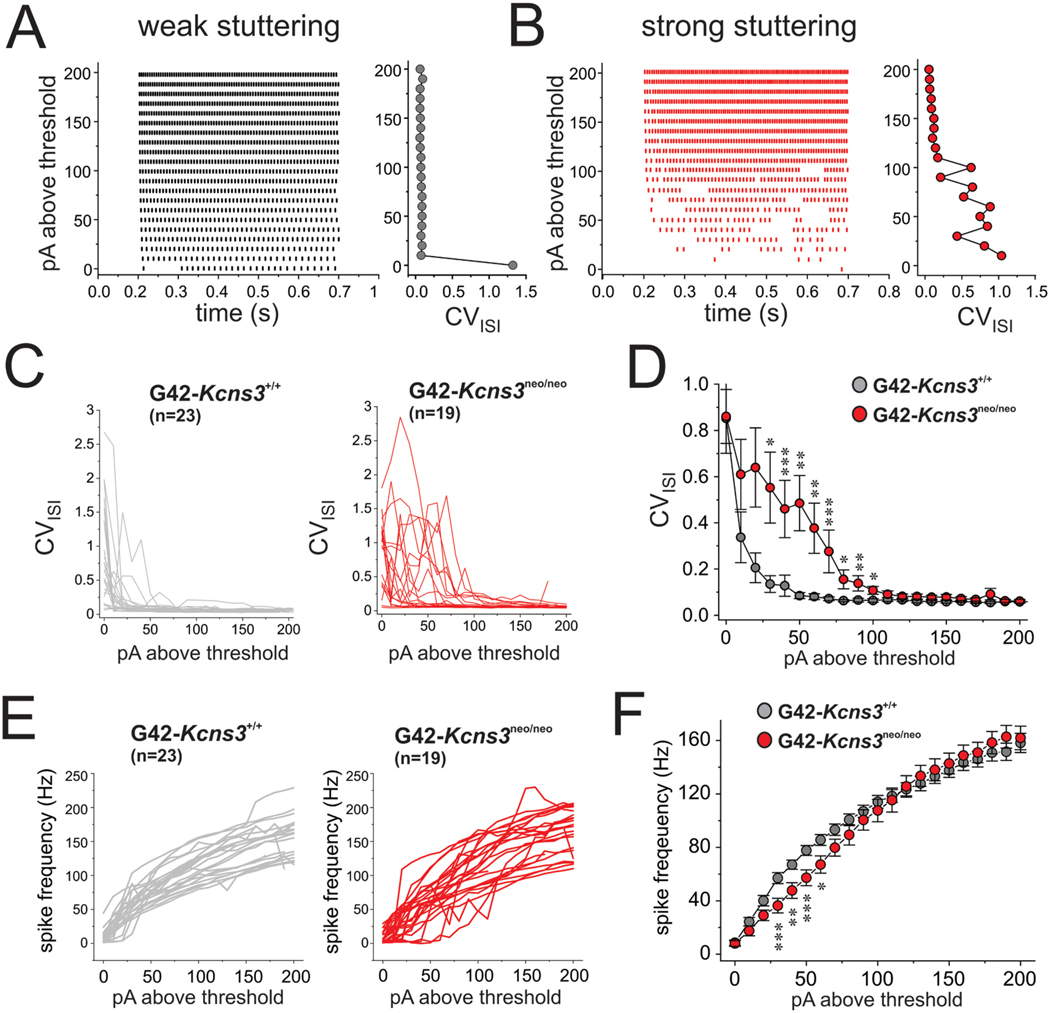
Effects of Kcns3 deficiency on the variability of inter spike intervals (ISIs) in spike trains evoked by injection of current steps. A) Left panel, representative raster plot for spike trains evoked in a weak stuttering parvalbumin-positive basket cell (PVBC) in the prefrontal cortex (PFC) of a G42-Kcns3+/+ mouse. Right panel, coefficient of variation of ISIs (CVISI) (X-axis) graphed as a function of stimulus current above threshold (Y-axis). B) Representative raster plot and CVISI graph as in A), but for spike trains evoked in a strong stuttering PVBC in PFC of a G42-Kcns3neo/neo mouse. C) Graphs of CVISI as a function of stimulus current above threshold for each of the PVBCs of G42-Kcns3+/+ (left, n = 23 cells from 11 mice) and G42-Kcns3neo/neo mice (right, n = 19 cells from 8 mice). D) Graphs of CVISI (mean ± SEM) as a function of stimulus current above threshold for the PVBCs of G42-Kcns3+/+ and G42-Kcns3neo/neo mice displayed in C). Shapiro-Wilk tests of the original data produced p values <0.05 at all current levels 0–130pA above threshold and p values <0.05 with Ln-transformed data at all current levels above threshold except 10, 20, 30 and 40 pA. Hence, we employed Mann-Whitney’s tests. *: p < 0.02, **: p < 0.01, ***: p < 0.005. E) Left, graphs of mean spike frequency per current step as a function of stimulus current above threshold for each of the PVBCs of G42-Kcns3+/+ (left, n = 23 cells from 11 mice) and G42-Kcns3neo/neo (right, n = 19 cells from 8 mice) mice. F) Graphs of spike frequency (mean ± SEM) as a function of stimulus current above threshold for PVBCs of G42-kcns3+/+ and G42-kcns3neo/neo mice. For most comparisons at current levels 0–100 pA above threshold, Shapiro-Wilk tests produced p values <0.05 with original and Ln-transformed data, hence Mann-Whitney’s tests were employed. *: p < 0.02, **: p < 0.01, ***: p < 0.005.

