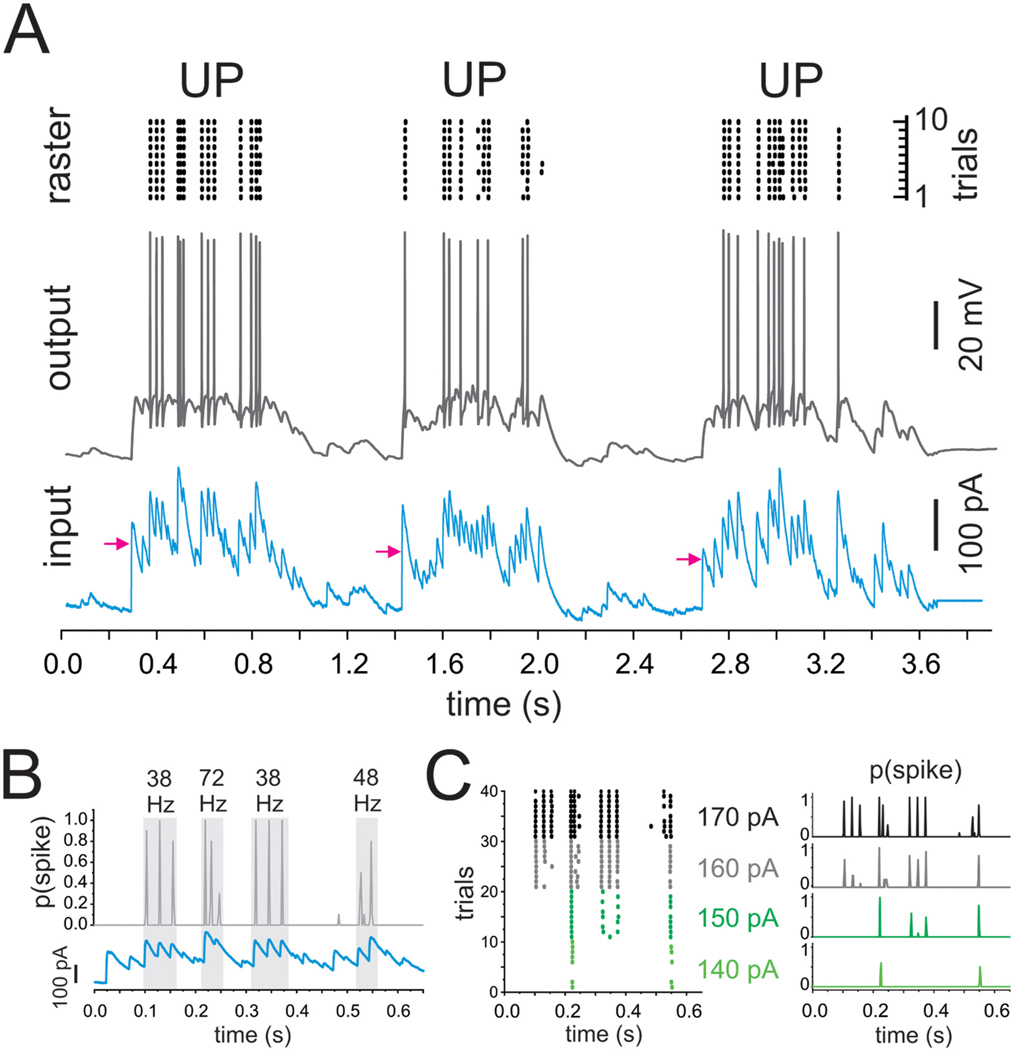
Fig. 8.
The current injection paradigm employed to assess the effects of Kcns3 deficiency on the response of PVBCs to UP states-like stimuli. A) The traces at the bottom (input) show the injected depolarizing current mimicking synaptic input during three UP states (UP(1), UP(2), and UP(3)) with two intermediate DOWN states. The arrows represent the mean injected current obtained by averaging the current injected across the duration of each UP state. Traces in the middle (output) show the spike output evoked in a parvalbumin-positive basket cell (PVBC) by the UP state current injection. The raster plots at the top were obtained from the spike trains evoked in the PVBC by 10 repetitions of the UP state current injection at stimulus strength 4 in 10 consecutive trails. B) The top graph shows the average spike probability, p(spike), computed in 2 ms bins throughout the injection of UP(1) repeated ten times at the stimulus strength 4. The bottom graph shows the depolarizing current injected during UP(1). The gray rectangles indicate the time windows of bursts of gamma band activity, with frequency measured from the intervals between subsequent peaks of p(spike). C) Left, raster plots from spike trains evoked by injection into a PVBC of UP(1) at stimulus strengths 1 to 4 (the mean injected current during UP(1) was 140, 150, 160 and 170 pA in this example). Right, spike probability p(spike) computed from the raster plots in the left panel.

