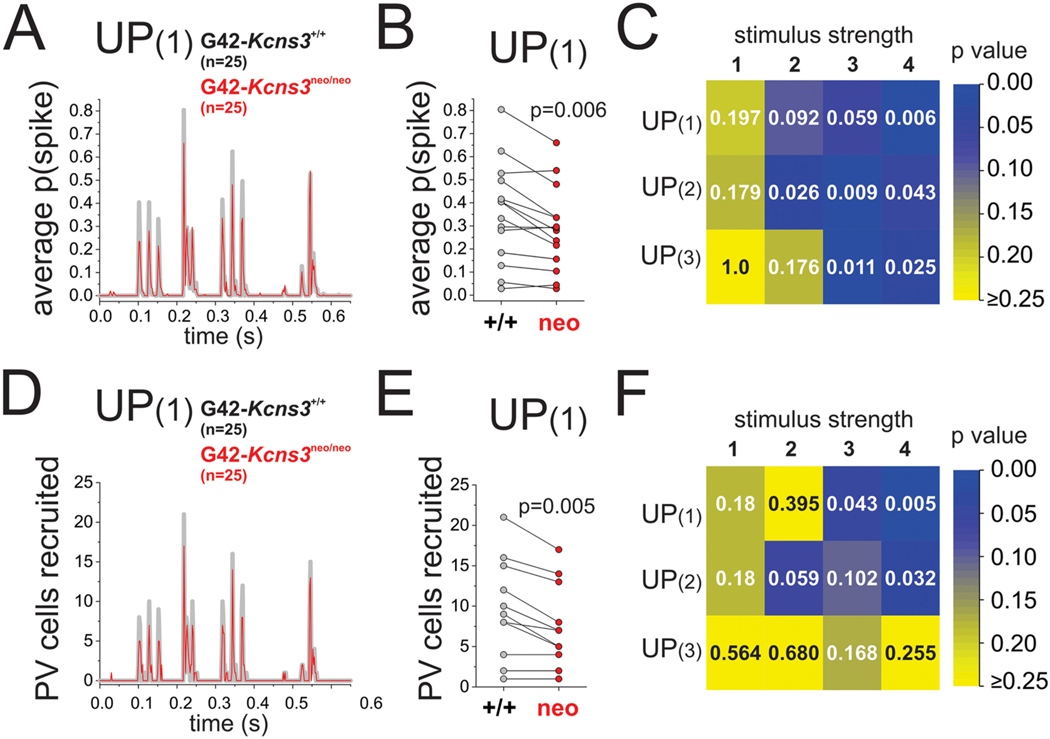
Fig. 9.
Effects of Kcns3 deficiency on the spike output of parvalbumin-positive basket cells (PVBCs) during UP states. A) Curves of mean spike probability, p(spike), during UP(1) at stimulus strength 4, computed by averaging p(spike) across 25 cells from 15 G42-Kcns3+/+ mice and 25 cells from 14 G42-Kcns3neo/neo mice. B) Paired comparison of p(spike) for the corresponding peaks of spike probability depicted in A). C) Matrix plot showing the p values of paired comparisons for matching peaks of p(spike) between G42-kcns3+/+ and G42-kcns3neo/neo mice during injection of UP(1), UP(2) and UP(3) at stimulus strengths 1–4. For most combinations of UP state and stimulus strength, Shapiro-Wilk analysis produced p values <0.05 with the original and the Ln-transformed data. Hence, here and in B), we report the p values of Wilcoxon Signed Rank tests. D) Curves of the number of PVBCs recruited by a single presentation of UP(1) at stimulus strength 4, computed for the 25 cells from G42- Kcns3+/+ and 25 cells from G42-Kcns3neo/neo mice. E) Paired comparison of the number of PVBCs recruited by a single presentation of UP(1) for the matching peaks depicted in D). F) Matrix plot showing the p values of paired comparisons for matching peaks of number of PVBCs recruited among the 25 PVBCs between G42- Kcns3+/+ and G42-Kcns3neo/neo mice during injection of UP(1), UP(2) and UP(3) at stimulus strengths 1–4. For most combinations of UP state and stimulus strength, Shapiro-Wilk analysis produced p values <0.05 with the original and the Ln-transformed data. Hence, here and in E), we report the p values of Wilcoxon Signed Rank tests.

