
Figure 2. Deep proteome sequencing reveals the tissue-specific localization and relative abundance of proteins expressed in Medicago truncatula.
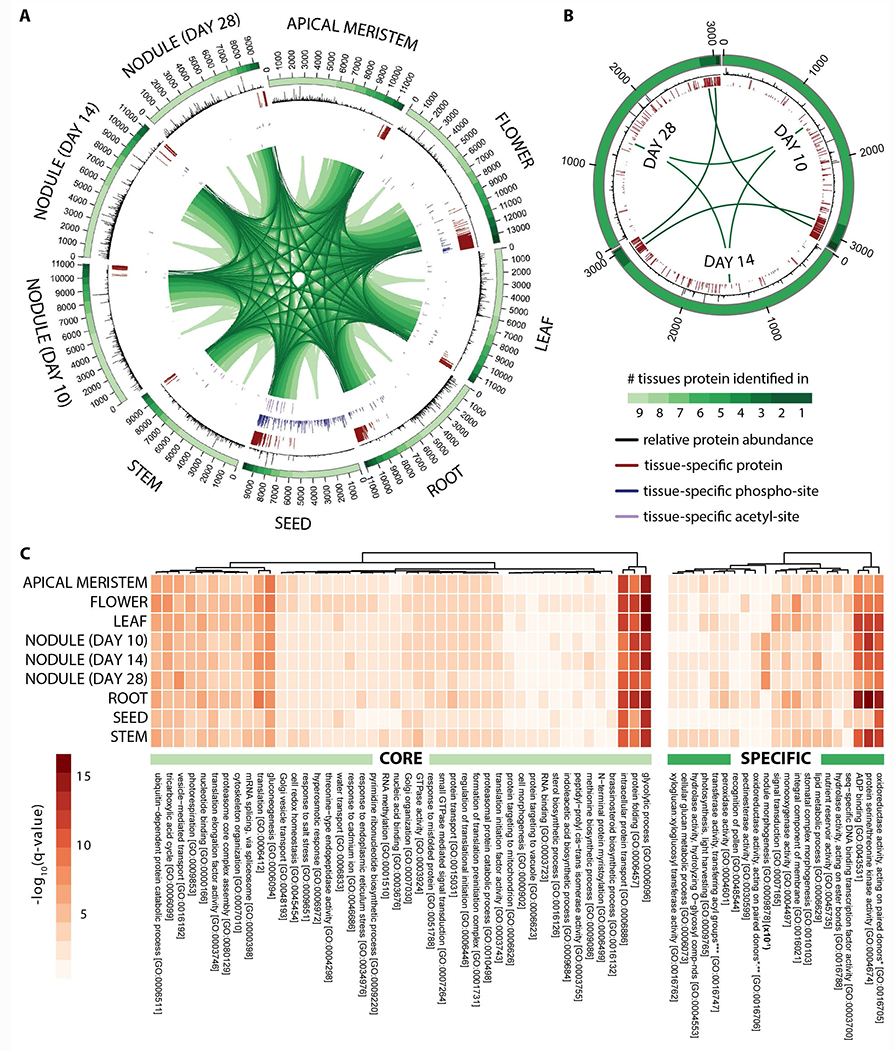
Circular proteome maps depict the similarities and differences in the tissue-specific proteomes acquired following proteome analysis of (A) nine different M. truncatula tissues (apical meristem (bud), flower, leaf, root, seed, stem, and nodules 10, 14, and 28 days past infection) and (B) nodule rhizobia (10, 14, and 28 days past infection). The number of protein identifications associated with each tissue is displayed in the bars that span each distinct tissue region. The color gradient within these bars reflects the number of tissues each protein identification is associated with (i.e., those proteins represented by the lightest green region were found within every tissue whereas those represented by the darkest green region were uniquely identified in that given tissue). The relative abundance of each protein within a given tissue is represented by the histograms (black) that span the length of each identification bar. Tissue-specific proteins, phosphorylation-sites, and acetylation-sites are indicated by the red, blue, and purple bars, respectively. Note that the length of each bar reflects the tissue-specificity of each protein or PTM site (longer bars represent a greater degree of specificity). (C) Heatmaps illustrate the most significantly enriched gene ontology biological processes carried out by the core (left) and specific (right) proteins within each tissue. Note that the nodule morphogenesis q-values displayed have been 10x reduced in this figure.
*with incorporation or reduction of molecular oxygen
**2–oxoglutarate as one donor, and incorporation of one atom each of oxygen into both donors
*** other than amino–acyl groups