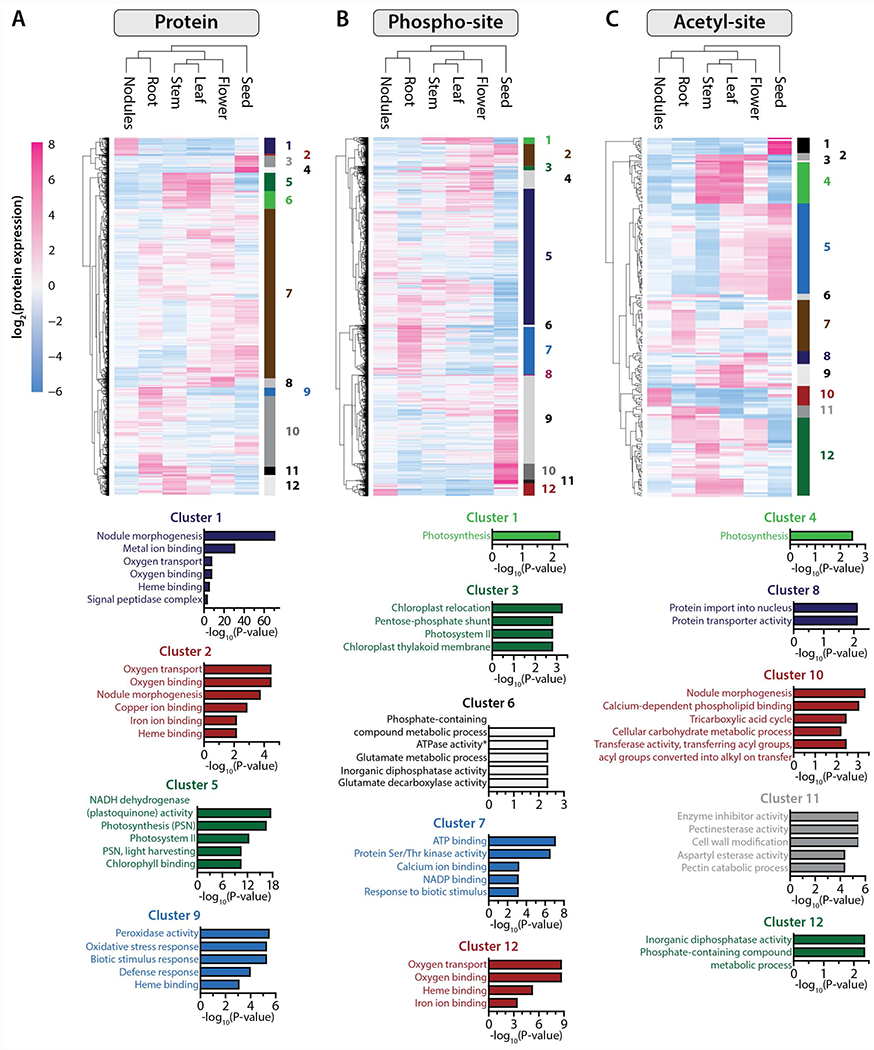
Figure 3. Protein localization and post-translational modification dictate organ-specific processes.

Heatmaps are composed of all proteins (A) phospho-isoforms (B) and acetyl-isoforms (C) found to be significantly changing (ANOVA, q < 0.01) between the six different tissues included in this study (n = 4,765, n= 11,101 and n = 234, respectively). Expression data were grouped using hierarchical clustering (Euclidean distance metric), both on the protein/PTM-isoform level (rows) and on the sample level (tissue). For each dataset, proteins/PTM-isoforms were grouped into twelve clusters, each of which were subjected to gene ontology (GO) functional annotation. The bar plots below each heatmap illustrate the top GO terms significantly enriched within select clusters (p-values associated with each cluster have been corrected for multiple hypotheses and are shown on the x-axes).
