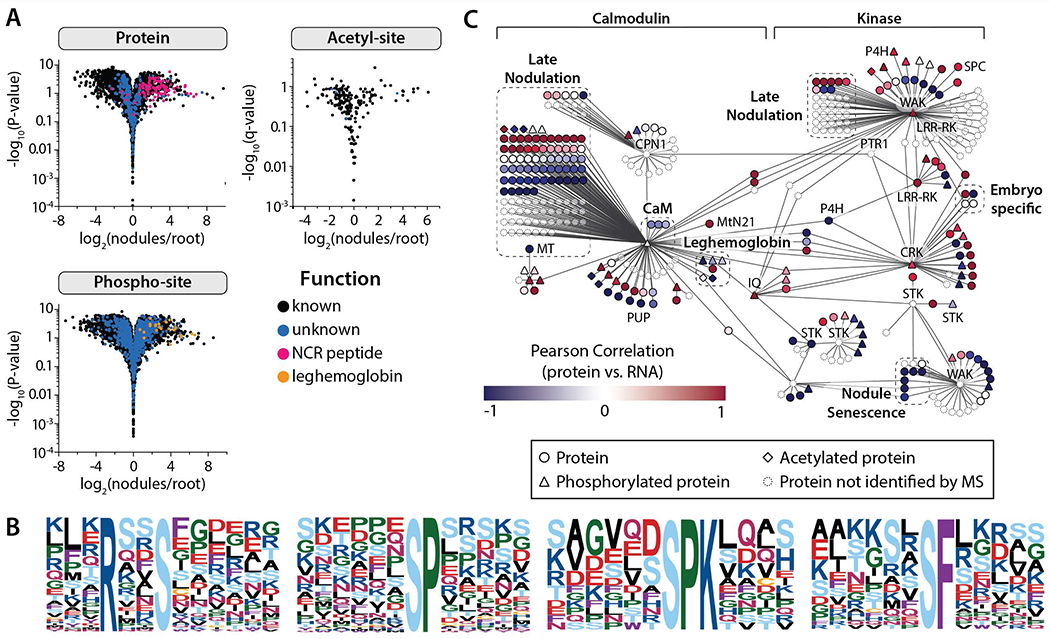
Figure 4. Nodule-specific proteins and post-translational modifications provide evidence for key regulatory mechanisms that drive the development and sustainability of the organ.

(A) Volcano plots compare protein and PTM-isoform expression in nodules vs. root tissues (Student’s t-test), indicating those proteins and PTMs that are nodule-specific. (B) All phosphorylation motifs identified in nodule-specific PTM isoforms (specificity determined by Student’s T-test analysis (fold-change > 2 and q < 0.01). Each pLOGo represents the statistical significance of a motif identified by performing phospho-serine motif analysis. The taller a residue is in the pLOGo, the more statistically significant it is to the motif. (C) A nodule-specific sub-network was extracted from the global co-expression network (Figure S4) by mapping nodule-specific proteins (specificity determined by Student’s T-test analysis (A); fold-change > 2 and q < 0.01) to the co-expression network and isolating the distinct cluster that resulted. The sub-network is organized based on the classification of hub genes, which were either calmodulin-like/calmodulin-binding or kinases. Pearson correlation coefficients were calculated by comparing protein and transcript expression over the 10, 14, and 28 dpi time-points; the color of each node reflects the coefficient calculated for that gene. Select gene families have been illustrated by dashed boxes. Genes not identified by our protein analysis have been faded.
