
Figure 5. M. truncatula and S. meliloti nodule time-course data reveals proteome changes that occur during nodule development and the establishment of rhizobial symbiosis.
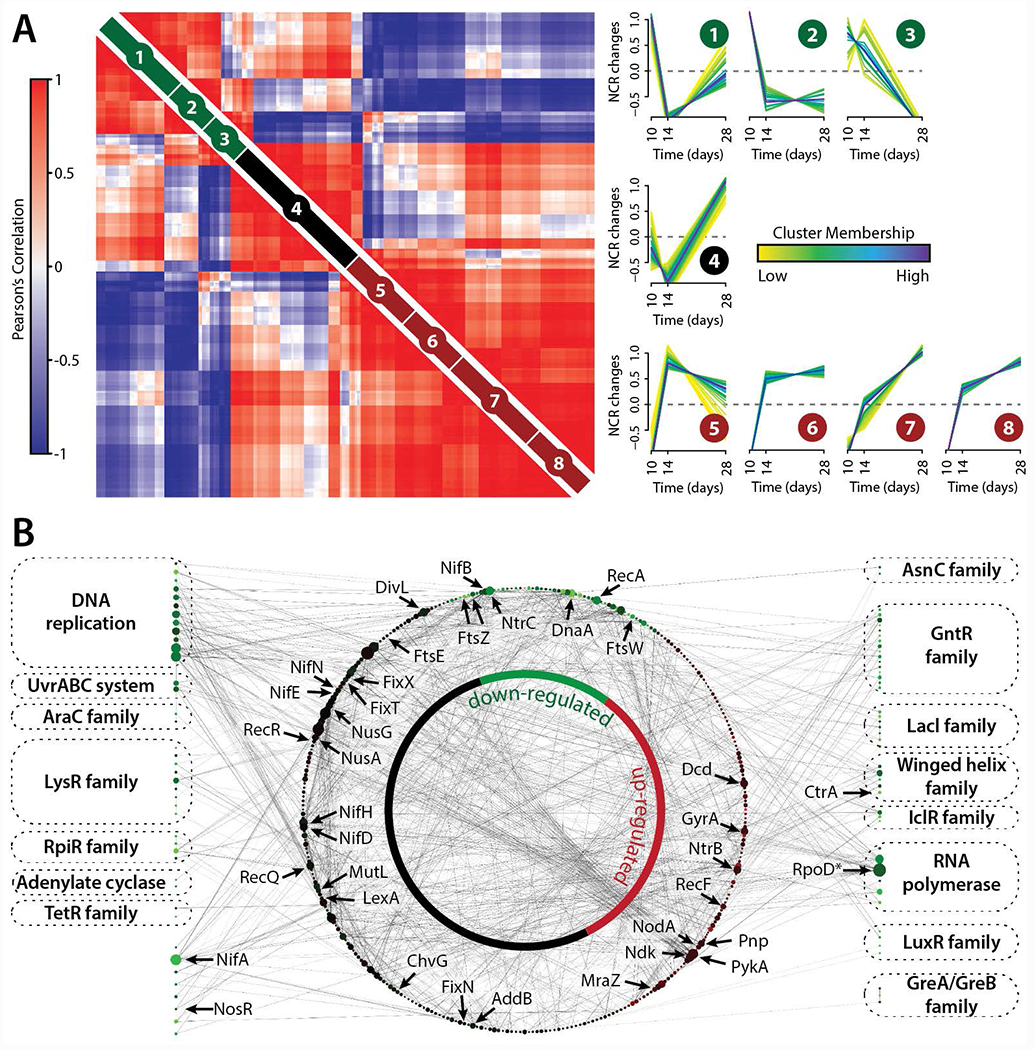
(A) Pair-wise Pearson correlation coefficients were calculated using M. truncatula NCR peptide abundance measurements obtained from the deep sequencing analysis (n = 252). NCR peptide time-course profiles were grouped into eight clusters using fuzzy c-means clustering. Darker trace colors reflect stronger membership to the given cluster. NCR peptide Pearson correlation values (left) were grouped using hierarchical clustering within each the fuzzy cluster (right). (B) S. meliloti DNA binding proteins down-regulated (>2-fold) from 10 to 28 days past rhizobial infection (Figure S7) were extracted (shown along border) and mapped to their corresponding protein-protein interactions (STRING database, shown within inner network circle). The size of each protein node reflects its degree within the network and the color of each node reflects how its protein expression changed over the 18-day time course.