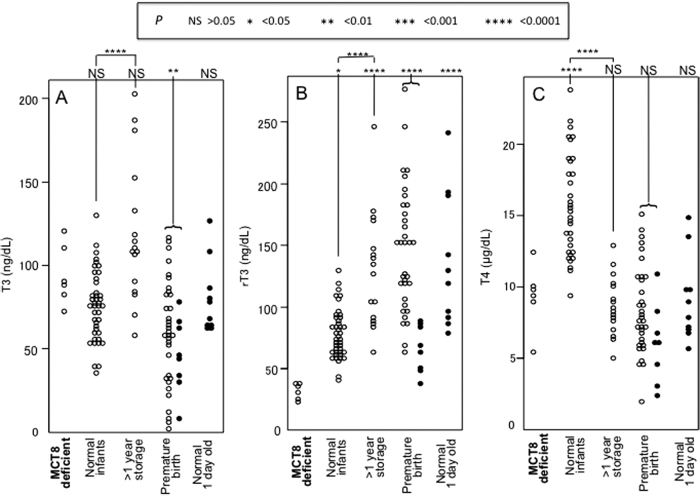
FIG. 1.
Concentrations of T3 (A), rT3 (B), and T4 (C) in individual DBS samples in groups identified on the bottom of each panel. p-Values obtained by comparisons using ANOVA between samples from MCT8-deficient and each other group are given on top of each panel. The p-values of differences between the samples from normal neonates one of which was stored for more than 1 year (1.1–2.3 years) are also shown. Open circles identify samples collected in Japan and closed circles identify samples collected in the United States. ANOVA, analysis of variance; DBS, dried blood spot; MCT8, monocarboxylate transporter 8; rT3, reverse T3; SD, standard deviation; T3, triiodothyronine; T4, thyroxine.

