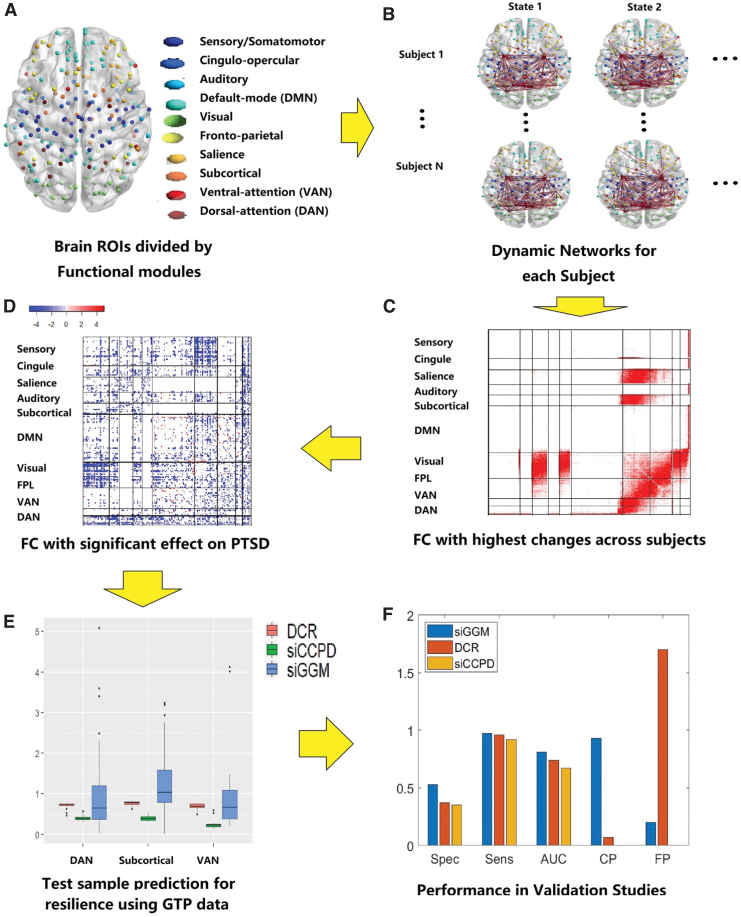
FIG. 2.
The proposed analysis pipeline. (A) Illustrates the nodes used in brain functional connectivity that are distinguished based on the known functional modules. (B) Illustrates the computed dynamic functional connectivity separately for each individual, the method for which is detailed in the Methods section and Figure 1. (C) Depicts a heatmap with summary measures that reflect the degree of temporal variation for edges across all the individuals. (D) Illustrates our discovery regarding the edges whose temporal fluctuations are directly related to trauma resilience. (E) Provides boxplots for out-of-sample prediction accuracy using the edge-wise dynamic connections to predict the continuous clinical outcome, through the scalar-on-function statistical methodology. (F) Provides a visual depiction of the performance metrics from our extensive validation studies comparing the proposed approach with alternative methods. AUC, area under the ROC curve; CP, change Point Detection; DAN, dorsal-attention network; DCR, dynamic connectivity regression; DMN, default mode network; FP, false positive of CP; FPL, frontoparietal; GTP, Grady Trauma Project; PTSD, post-traumatic stress disorder; ROI, region of Interest; siCCPD, proposed method; siGGM, Bayesian structurally informed Gaussian graphical models; VAN, ventral-attention network. Color images are available online.

