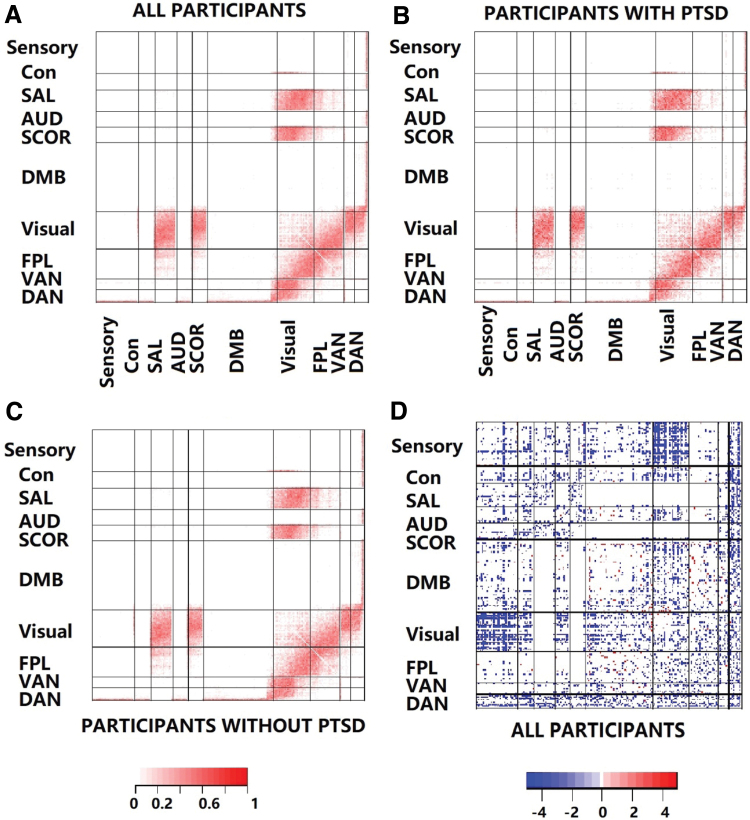
FIG. 4.
(A–C) Illustrates the edge-wise temporal variation averaged over all individuals, individuals with PTSD, and those without PTSD, respectively. Here, the temporal variation for an edge was calculated as the ratio of the number of state changes for that edge divided by the number of state changes in the network. Edges in several modules including Visual, SAL, SCOR, VAN, and DAN show strong temporal fluctuations resulting from frequent state changes. On the contrary, the Sensory, Cingulomotor, and DMN register the fewest temporal fluctuations over time. Only 213 edges illustrated significant differences in terms of the proportion of edge-specific state changes between the PTSD and non-PTSD groups, which suggests the inadequacy of this measure to distinguish disease severity. Of these 213 edges, almost all had a higher frequency corresponding to the PTSD group, illustrating higher temporal fluctuations in this cohort. (D) Illustrates edges whose fluctuations in terms of the edge strength (measured through edge-specific standard deviations for partial correlations over time) are significantly related to PTSD resilience (multiplicity adjusted). Most of these edges lie between functional modules and are contained between the Visual and other modules, as well as between the DAN and other modules. Blue and red colors imply a negative and positive association with PTSD resilience, respectively. It is clear that an increase in temporal edge strength fluctuations in most edges leads to decrease in resilience and vice versa. However, a small number of connections within DMN and between DMN and other modules lead to increased resilience corresponding to higher fluctuations in edge strength and vice versa. AUD, auditory; CON, cingulo-opercular; DMB, default mode network; SAL, salience; SCOR, subcortical. Color images are available online.

