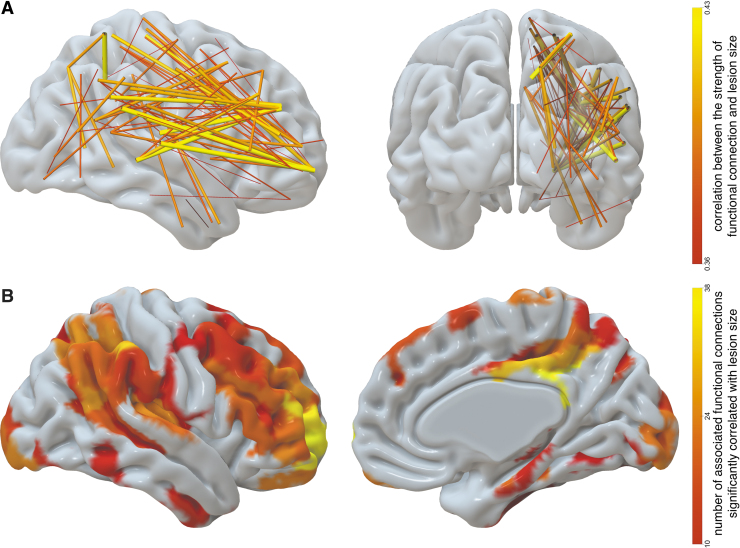
FIG. 2.
(A) Contralateral functional connections that have the strongest correlation with lesion size (only strongest 10% of 828 such connections are displayed). The width and color indicate the strength of correlation with lesion size. (B) Contralateral regions associated with functional connections that are significantly correlated with lesion size. The color of the ROI encodes the number of functional connections stemming from that ROI, which are significantly correlated with lesion size; only ROIs with at least 10 such connections are displayed. ROI, region of interest. Color images are available online.

