
Figure 1.
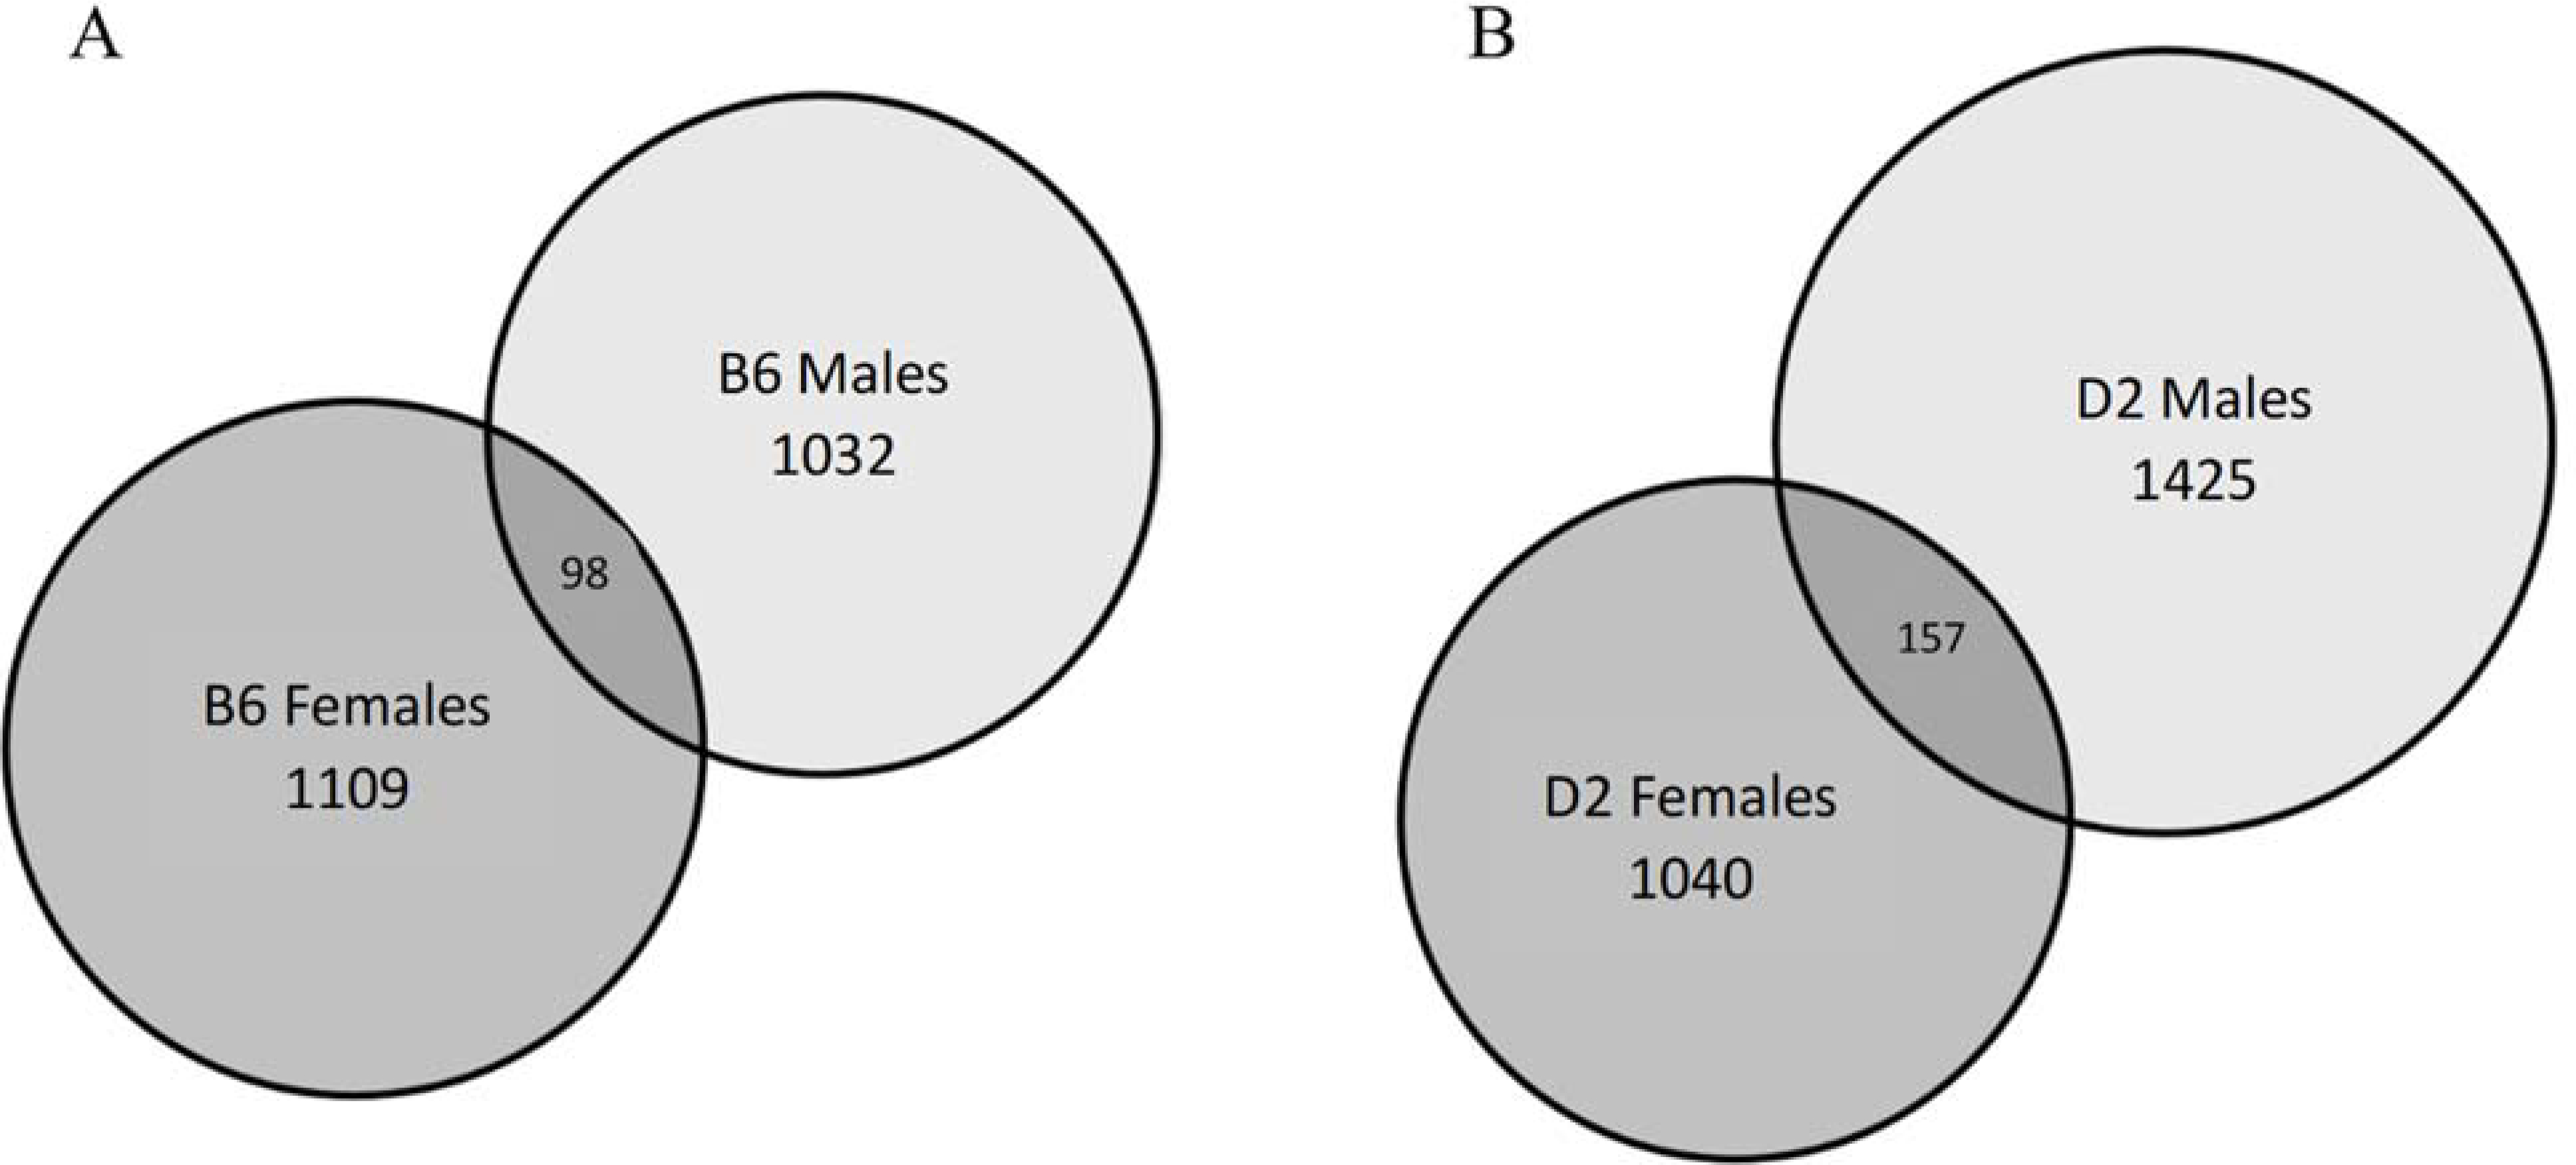
Minimal overlap of ethanol-mediated gene expression changes between sexes are represented by Venn diagram. Numbers within the circles represent significant (p<0.05) ethanol-mediated expression changes. A) C57BL/6J (B6) and B) DBA/2J (D2) mice. Both strains show similar patterns, with a higher number of changes in males than females and low overlap. Left circle: female-specific expression; right circle: male-specific expression; overlapping dark gray: ethanol-mediated changes in both sexes. n=10/per sex, strain and treatment; 80 total cDNA arrays