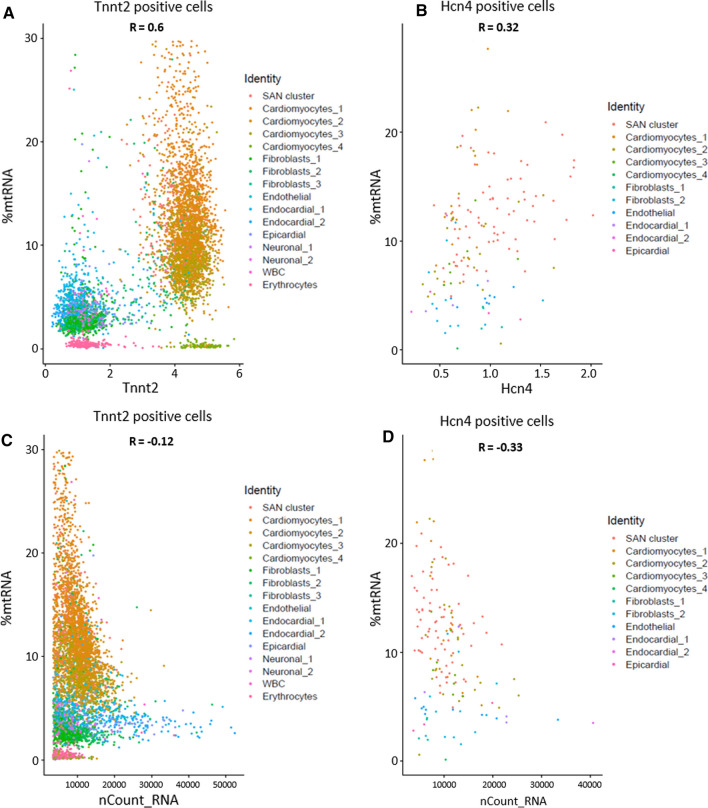
Fig. 2.
Scatter plots illustrating the correlation of %mtRNA and other parameters. A In Tnnt2 positive cells, there is a positive correlation between %mtRNA and the cardiac marker Tnnt2. B In Hcn4 positive cells, there is a positive correlation between %mtRNA and the pacemaker cell marker Hcn4. C In Tnnt2 positive cells, there is a weak negative correlation between the fraction of mitochondrial gene transcripts and the total number of gene transcripts per cell. D In Hcn4 positive cells, there is a negative correlation between the fraction of mitochondrial gene transcripts and the total number of gene transcripts per cell

