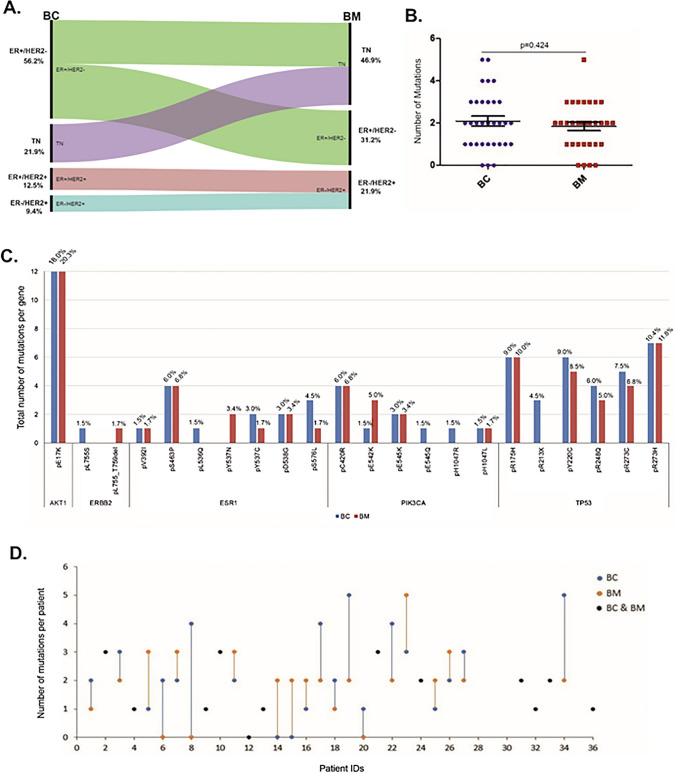
Fig. 1.
Receptor switch and mutation detection in paired BC and BM samples. A The Alluvial diagram illustrates the receptor (ER, PgR, HER2) switch between primary BC and their paired BM cases including % for each subtype. B No significant association was identified (p = 0.484) in the number of mutations between primary BCs and their paired BMs. C Total number of mutations per gene identified in both BC (blue) and BM (red) samples. The percentage of each mutation over the total number of mutations is presented on the top of each bar and on supplementary table 3. D Scatter-plot showing the number of mutations for each pair. Blue dots-lines and red dots-lines represent the number of mutations changing between BC and from BM. Black dots represent the cases with similar number of mutations in both the primary BC and its paired BM

