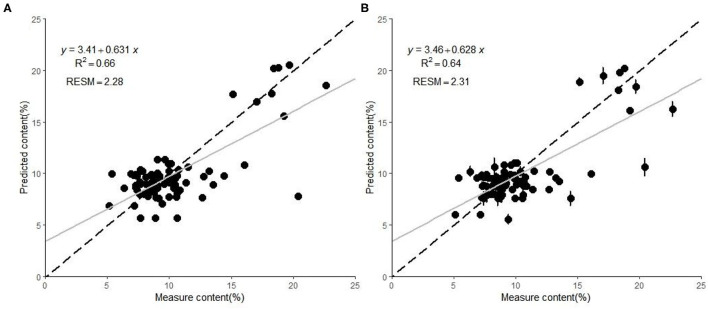
Figure 1.
Scatterplots of the malondialdehyde (MDA) in pine seedlings predicted by (A) the detrended variable–significant multivariate correlation algorithm (DET-sMC) partial least squares (PLS) model and (B) the full-spectrum PLS model. The error bar of each symbol point represents the sample prediction error obtained by 100 random calibration models. The regression line of the model appears in gray; the dotted black line denotes the equality of measured vs. predicted MDA values.

