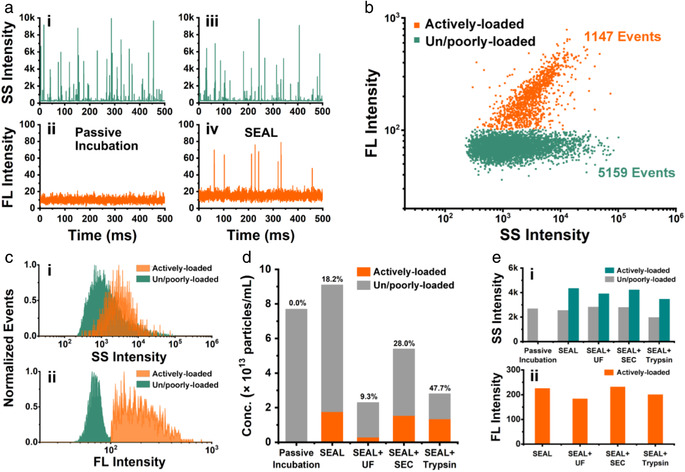
FIGURE 2.

Single particle analysis of the drug loading capacity of SEAL‐prepared Dox‐mEVs by nFCM. (a) Representative SS and FL‐Dox burst traces of the Dox‐mEVs prepared by passive incubation (i, ii) and SEAL (iii, iv). (b) Bivariate dot plots of SS verse FL‐Dox of SEAL‐prepared Dox‐mEVs. (c) SS (i) and FL‐Dox (ii) intensity distribution histograms of the two subpopulations in SEAL‐prepared Dox‐mEVs. (d) Particle concentration and the active loading fraction of Dox‐mEVs prepared and purified by various methods. Note. The numbers on the above of each column indicated the active loading fractions. (e) The median SS (i) and FL‐Dox (ii) intensity of Dox‐mEVs prepared and purified by various methods
