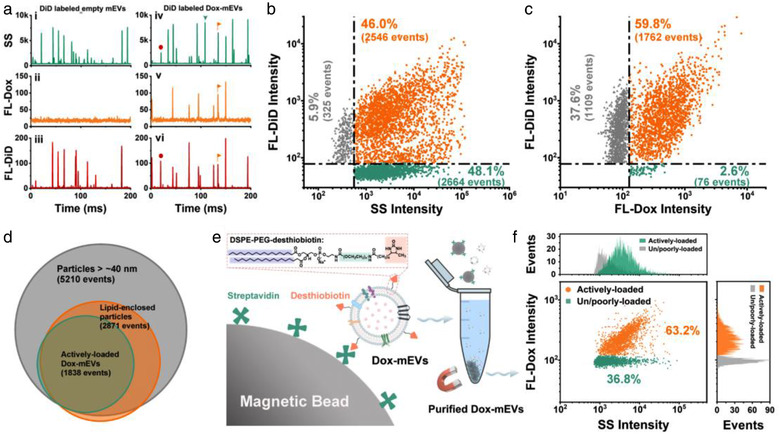
FIGURE 3.

Multi‐parameter analysis of the correlation between drug loading capacity and lipid labelling pattern of Dox‐mEVs. (a) Representative SS, FL‐Dox, and FL‐DiD burst traces of Dox‐mEVs without (i, ii, iii) or with (iv, v, vi) DiD labelling. (b) Bivariate dot plots of SS verse FL‐DiD. (c) Bivariate dot plots of FL‐DiD verse FL‐Dox. (d) A Venn diagram showing the overlap of different subpopulations in SEAL‐prepared Dox‐mEVs. (e) Schematic illustration of the lipid‐probe based magnetic purification process. (f) Bivariate dot‐plots of SS versus FL‐Dox and the corresponding SS and FL‐Dox histograms of the LPMIT‐purified Dox‐mEV samples
