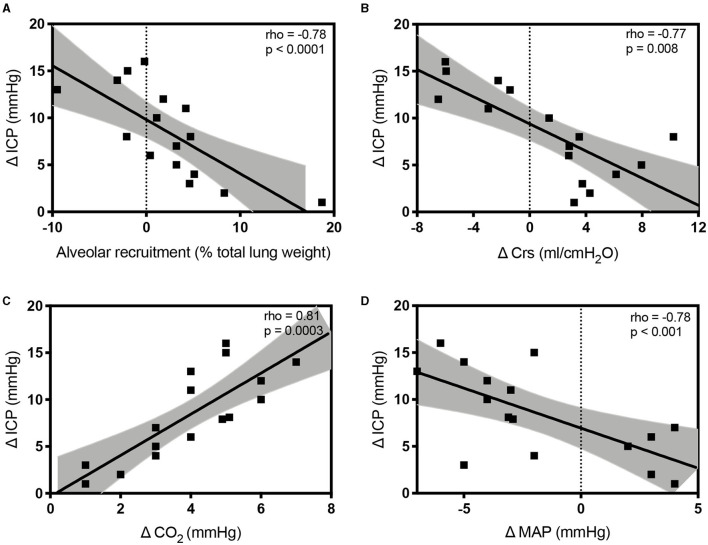
Figure 4.
Scatterplots showing the linear association and correlation between alveolar recruitment (A), Δ respiratory system compliance (Crs; B), Δ carbon dioxide (PaCO2; C), Δ mean arterial pressure (MAP; D) vs. Δ intracranial pressure (ICP) at different study time points. Dotted lines represent the 95% CIs for the linear regression.

