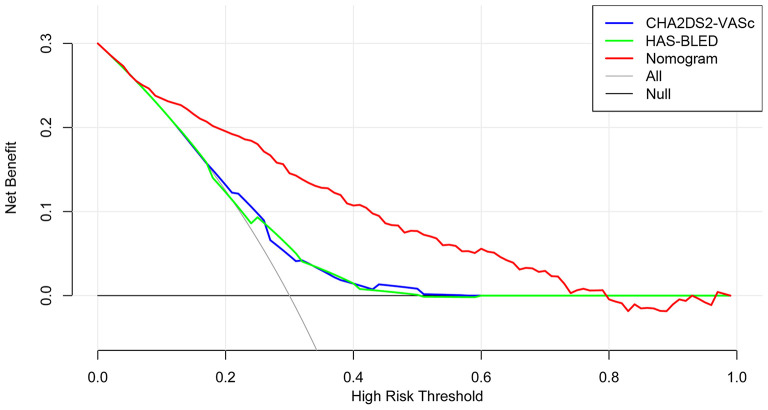
Figure 6.
Decision curve analysis of the nomogram, CHA2DS2-VASc score and HAS-BLED score. The y-axis represents the net benefit and the x-axis represents the threshold probability. The null plot represents the assumption that no patients survive, while the all plot represents the assumption that all patients survive at a specific threshold probability.

