. 2021 Oct 18;8:772326. doi: 10.3389/fmed.2021.772326
Copyright © 2021 Wu, Shi, Zhang, Yan, Shang, Wang, Lu, Gu, Dou, Wang and Yuan.
This is an open-access article distributed under the terms of the Creative Commons Attribution License (CC BY). The use, distribution or reproduction in other forums is permitted, provided the original author(s) and the copyright owner(s) are credited and that the original publication in this journal is cited, in accordance with accepted academic practice. No use, distribution or reproduction is permitted which does not comply with these terms.
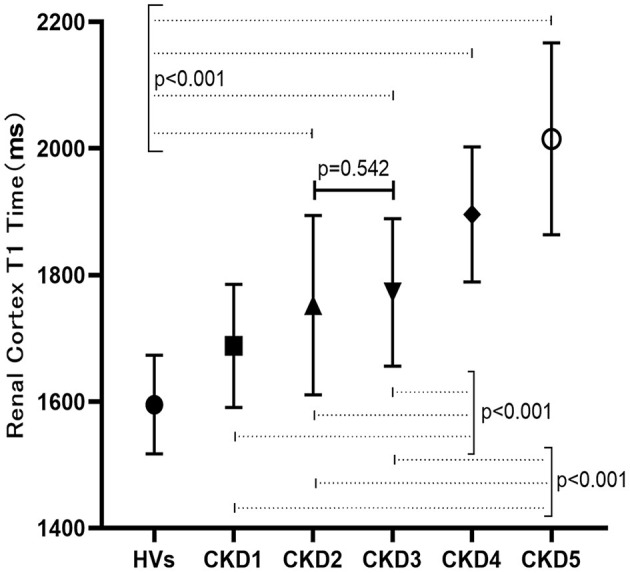
Figure 4.

T1 Comparison among HVs and CKD sub-groups.
