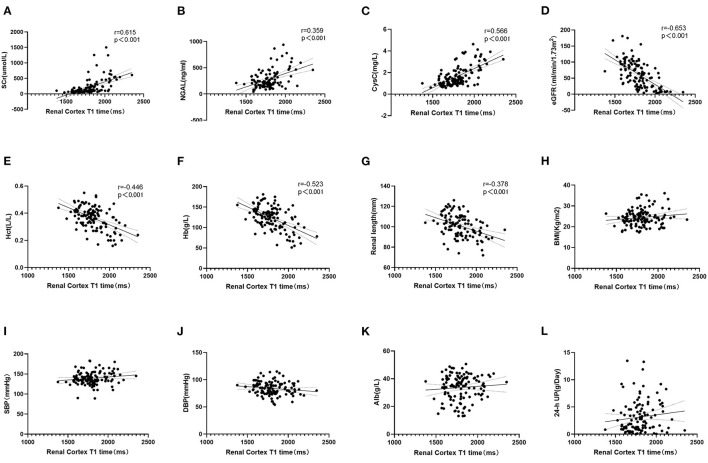
Figure 5.
(A–C) Correlation analysis between T1 and clinical indexes. T1 value was positively correlated with SCr, NGAL and CysC (p < 0.001). (D–G) Negatively correlated with eGFR, Hct, Hb, and Renal length (p < 0.001). (H–L) T1 value had no correlation with BMI, SBP, DBP, Alb, and 24-h UP (p > 0.05).

