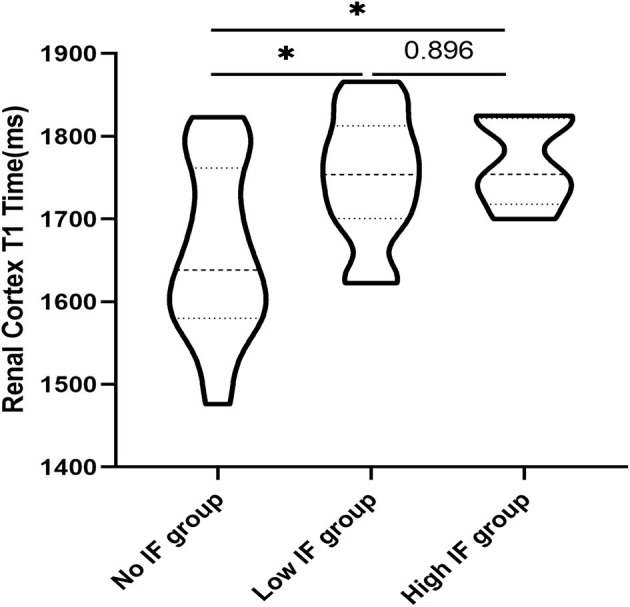
Figure 7.

Comparison of T1 values in the renal cortex of patients with different degrees of IF. T1 values in the renal cortex of the no IF group were lower than those of the low and high fibrosis groups (*p < 0.05), while T1 values in the renal cortex of the low and high fibrosis group had no significant difference (P > 0.05).
