Figure 8.

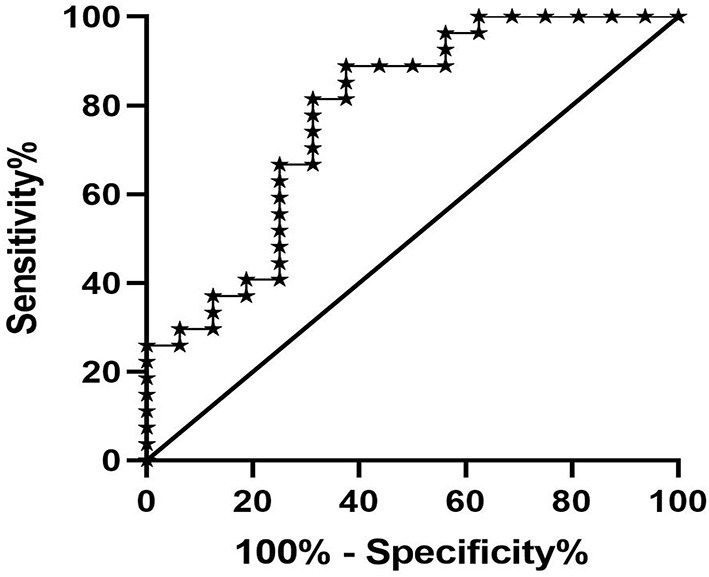
ROC analysis of T1 value in predicting renal fibrosis. The area under the ROC curve was 0.762, the optimal cut-off value was 1,695 ms, the specificity was 0.778, and the sensitivity was 0.625.

ROC analysis of T1 value in predicting renal fibrosis. The area under the ROC curve was 0.762, the optimal cut-off value was 1,695 ms, the specificity was 0.778, and the sensitivity was 0.625.