FIGURE 1.
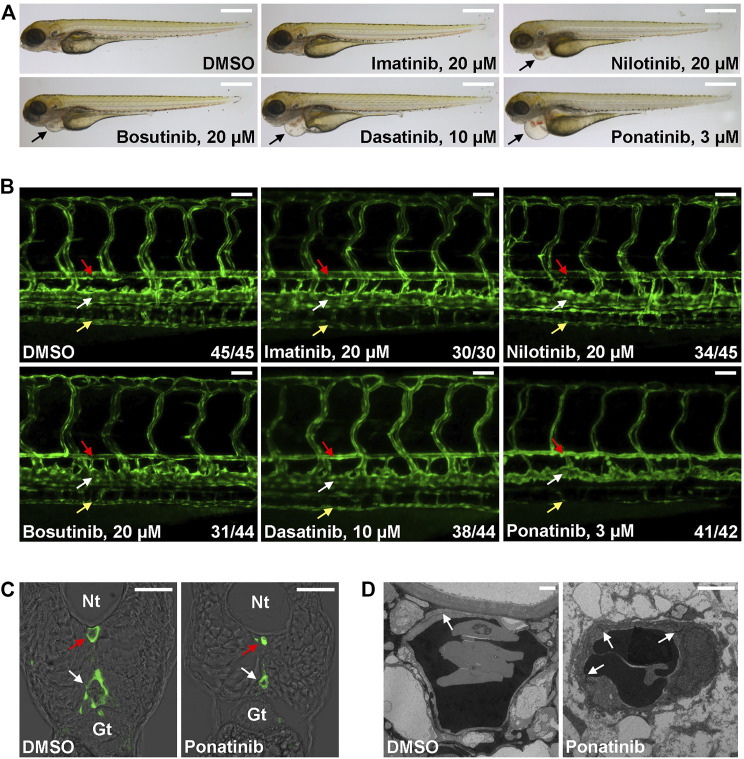
Cardiovascular defects in CML TKI treated zebrafish embryos. (A) Live imaging of embryos treated with the indicated concentrations of TKIs from 2 to 4 dpf. Arrows indicate cardiac edema. Scale bar: 500 µm. (B) Confocal imaging of vessel defects in TKI treated Tg(flk:GFP) embryos. Red arrow: dorsal aorta; white arrow: posterior cardinal vein; yellow arrow: subintestinal vein. At least two biological repeats were performed. Numbers indicate (number of embryos with shown phenotype/total number of embryos analyzed). Scale bar: 50 µm. (C) Cross-section of ponatinib-treated embryos. Nt: neural tube; Gt: gut; red arrow: dorsal aorta; white arrow: posterior cardinal vein. Scale bar: 50 µm. (D) TEM analysis of ponatinib-treated embryos. White arrow: aortic endothelial cell junctions. Scale bar: 2 µm.

