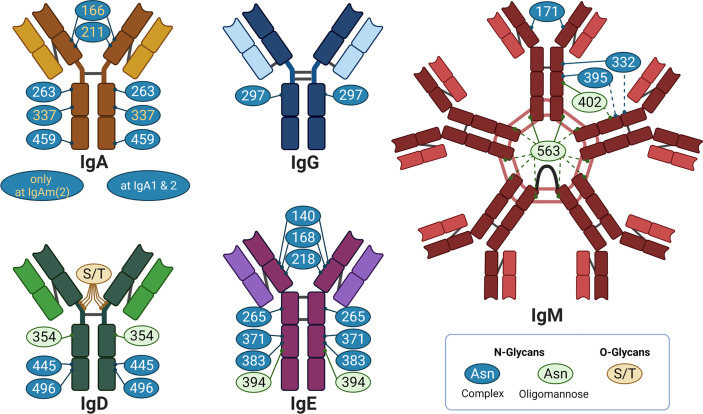
Figure 2.
Overview of glycosylation sites of different Ig: IgA, IgG. IgM, IgD, and IgE in individual colors. The bright color illustrates the light chain, the dark color the heavy chain. The grey lines indicate disulphide bridges. Created with BioRender.com.

