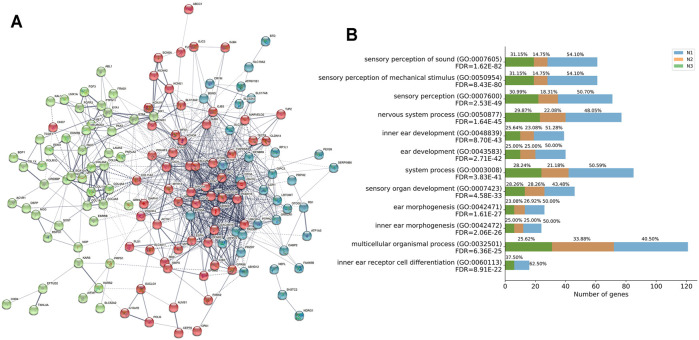
FIGURE 4.
Functional network and biological progress of HL-related genes. (A) Functional network of closely related HL-related genes based on the STRING database. Three independent networks were identified by k-means clustering (N1 red, N2 green, and N3 blue). Nodes are colored to show the associations, and the thickness of lines connecting nodes indicates the strength of the association between nodes. (B) GO enrichment analysis for the contribution of genes in three independent networks N1, N2, and N3 to the functional signaling pathways.

