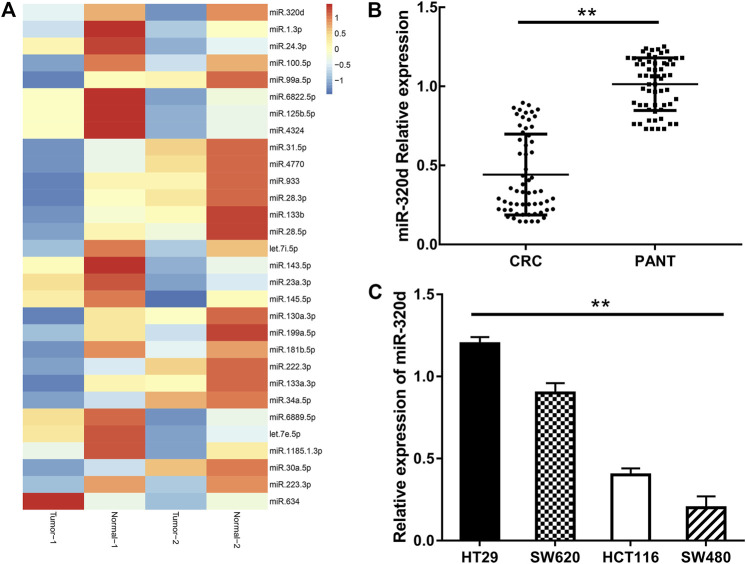
FIGURE 1.
The expressions of miR-320d were examined in the EGFR-positive colorectal cancer and cell lines. (A) The heatmap of the top 30 differentially expressed microRNA in EGFR-CRC and paired adjacent normal tissue. Each column represents a sample, and each row represents the expression level of a given microRNA. The color scale represents the raw Z score ranging from blue (low expression) to red (high expression). (B) qRT-PCR analysis of miR-320d in EGFR-positive CRC tissues (n = 60) and adjacent normal tissues (n = 60). (C) qRT-PCR analysis of miR-320d in EGFR-positive CRC cell lines. Statistical analysis was conducted using Student’s t test. **p< 0.01.

