Figure 3.
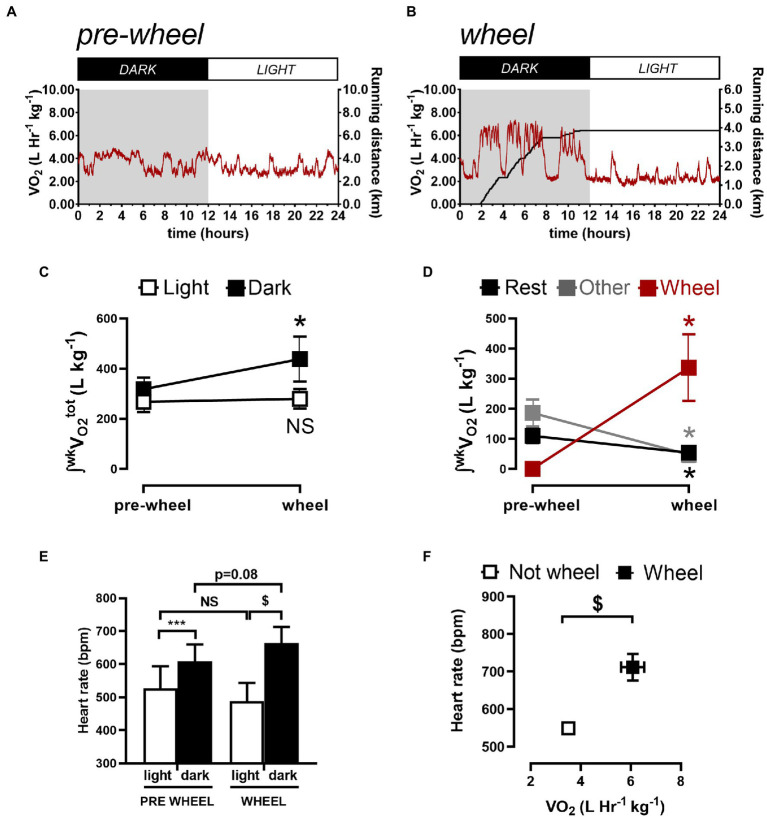
Quantification of weekly total oxygen consumption (∫wkVO2) associated with rest, non-rest/non-wheel (other) activity, and running (wheel) activity. Sample 24-h VO2 recordings before (A) and 1week after (B) a CD1 mouse gained access to a running wheel. (C) shows the integrated O2 consumed per week by mice during the light (sleeping) phase and during the dark (active) phase, before and after gaining wheel. (D) shows the integrated O2 consumed per week during the dark phase quantified during rest (sleeping), with wheel running and with “other” activities (i.e., neither sleeping or wheel running). (E) summarizes the HR results during the light and dark phases from before and after gaining access to running wheels. The data reveals that the HR differed between the light and dark phase for mice before and after gaining access to running wheels. HRs in the dark phase increased (p=0.02) while trending (p=0.08) toward reductions during the light phase after mice gained access to running wheels for 1week. (F) shows the relationship between HR and the VO2 when mice are not on the wheel versus when they are on the running wheel. Data are presented as Mean ± SD. *p < 0.05, ***p < 0.001, and $p < 0.0001 using a repeated measures one-way ANOVA with Holm-Šidak post-hoc test.

