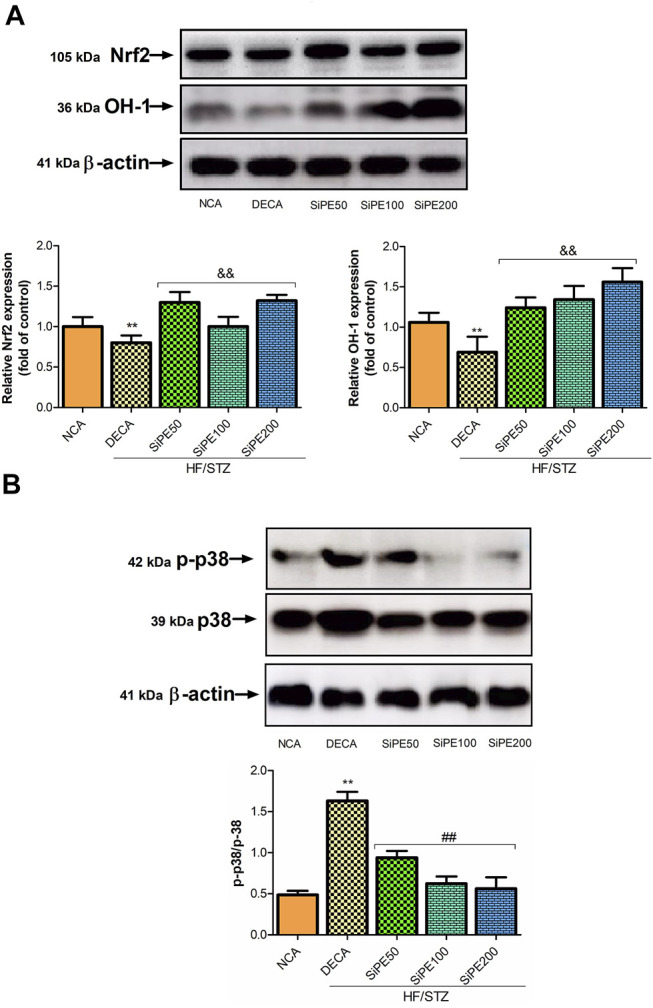
FIGURE 10.

Protein expressions of p-38, p-p38, Nrf2 and HO-1 in the brain tissues from NCA, DECA and SiPE treated groups. Data are presented as mean ± SD (n = 6) and one-way ANOVA test was applied. **p < 0.001 indicates statistical significance compared to NCA group. ##p < 0.001, &&p < 0.01 and $$p < 0.05 indicate statistical significance compared to DECA group.
