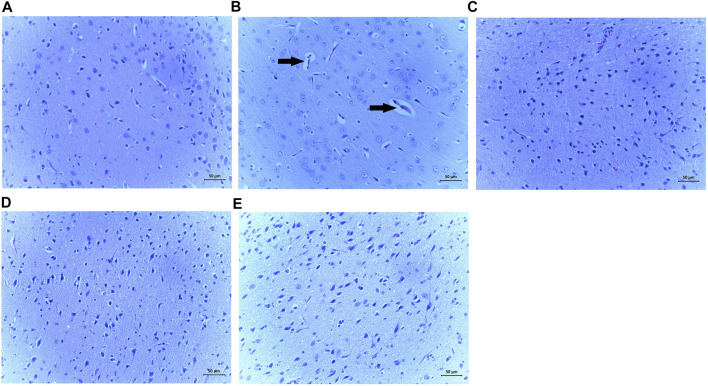
FIGURE 9.
Effect of SiPE treatment on histopathological features in HF/STZ-induced diabetic encephalopathic rats. Representative images of H&E staining of brain tissues showing (A) NCA group, (B) DECA group, (C) SiPE50 group, (D) SiPE100 group and (E) SiPE200 group. (magnification ×200, scale bar = 50 μm).

