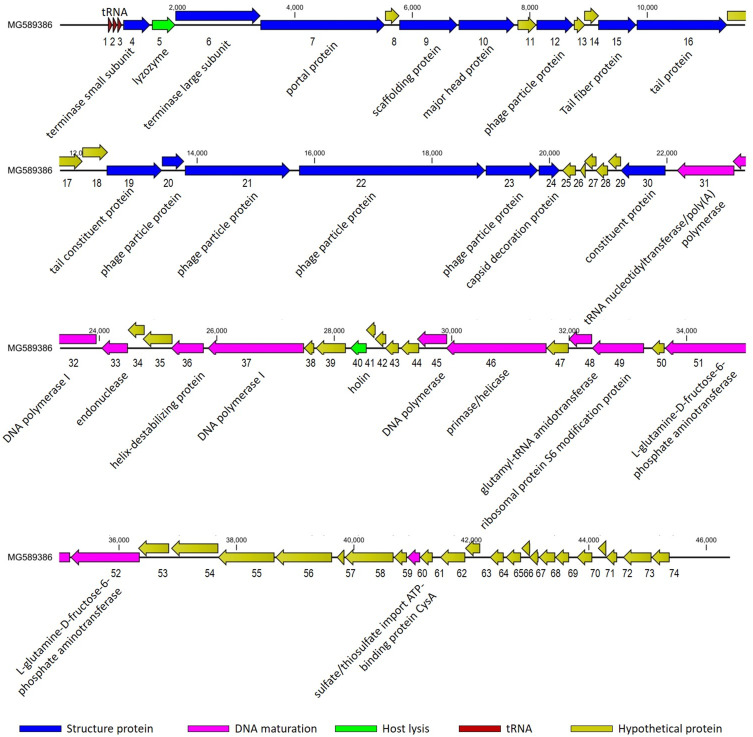
Figure 3.
Genomic map of vB_PaeP_PA01EW. The genome map was performed using the CLC Main Workbench, version 6.1.1 (CLC bio, Aarhus, Denmark). The genome is schematically presented with predicted ORFs indicated by arrows; the direction of the arrow represents the direction of transcription. Blue arrows, phage structural proteins; purple arrows, DNA regulation module; red arrows, tRNA; green arrows, host lysis, yellow arrows, hypothetical proteins.

